Rasuwagadhi · Trishuli corridor
On Wednesday 26 August 2026 (~03:00 UTC), a rock-and-ice avalanche detached from Lirung glacier (Rasuwa, Nepal) fell into the headwaters of the Lhende Khola — a river originating in Gyirong, Tibet. According to NP3, the mass formed a temporary dam over the deposits from the Purepu GLOF (2025), "possibly for only minutes", before breaching and releasing the flood; an independent analysis (geopera) modelled that dam and cannot distinguish a direct flow from a minutes-long blockage — the controversy is declared, not resolved. The flood crossed Tibetan territory, re-entered Nepal and descended the Bhote Koshi and the Trishuli: according to NP3, more than 130 km downstream from Rasuwagadhi, as far as Mugling. This panel measures the source → Trishuli dams reach (~52 km straight-line) with a single boundary: before vs. after 26 Aug, without prior hypothesis — radar for terrain disturbance, optical for water and sediment, and a dedicated chapter on the glacier itself: official catalogue identity, before and after. Every number carries its scene and its date; what cannot be measured is declared.
View on Google Maps · satellite 28.289° N · 85.528° E ↗Methodology and scope
(B03−B08)/(B03+B08) > 0, with cloud and shadow discarded via the SCL band. Each pre/post pair is compared only over pixels clean in both dates (declared common denominator). Sediment: NDTI = (B04−B03)/(B04+B03) over water common to both dates.RGI2000-v7.0-G-15-05732, GLIMS G085538E28285N), rasterised onto the AOI grid to verify coverage. Relief: Copernicus DEM GLO-30 — pre-event (2011–2015), used as relief context only, not to measure volumes.(B03−B11)/(B03+B11) > 0.4 at 20 m, compared only over clean pixels common to the pre/post pair (declared denominator). The false-colour SWIR B12/B11/B8A separates what true colour cannot: cloud appears bright white and ice dark/cyan.The full corridor, measured through the monsoon
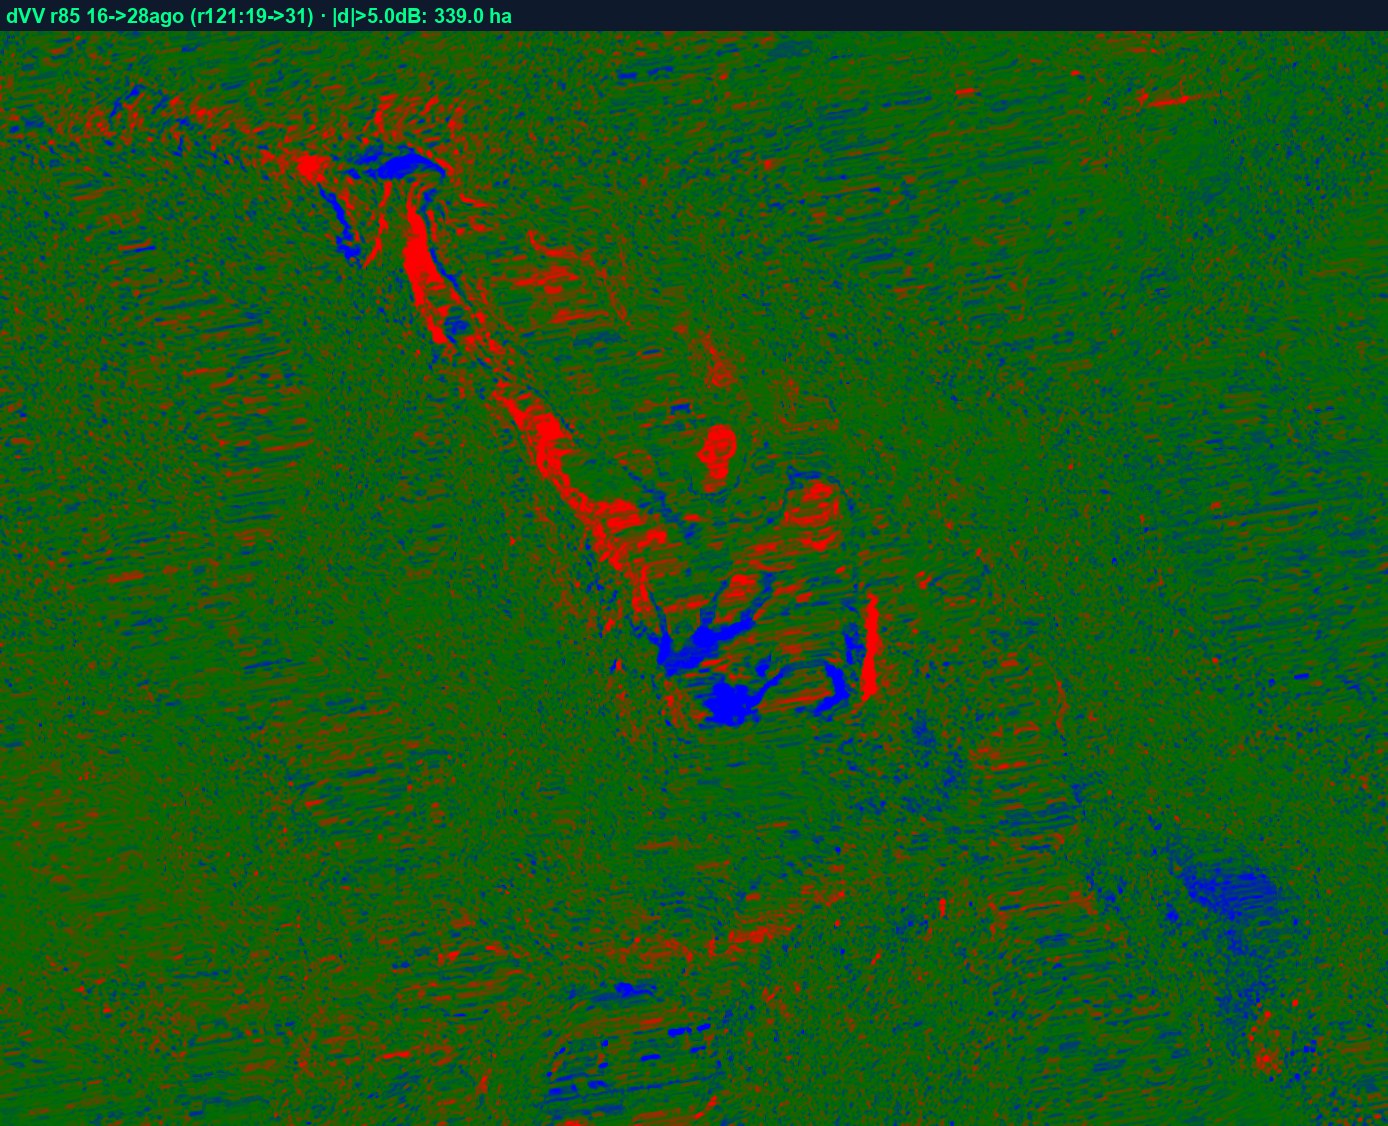
In the middle of the cloud season, radar delivered the only pre/post pair with 100% coverage of all four sites (same orbit r85, 16 → 28 Aug). The change map shows the event pattern: the dominant cluster is in the source zone (increases on hillslopes and decreases in valley floor), at the Trishuli dams the change forms rows that follow the valley floor, and outside the corridor the map stays clean — the two control boxes close at 0.09–0.16% background.
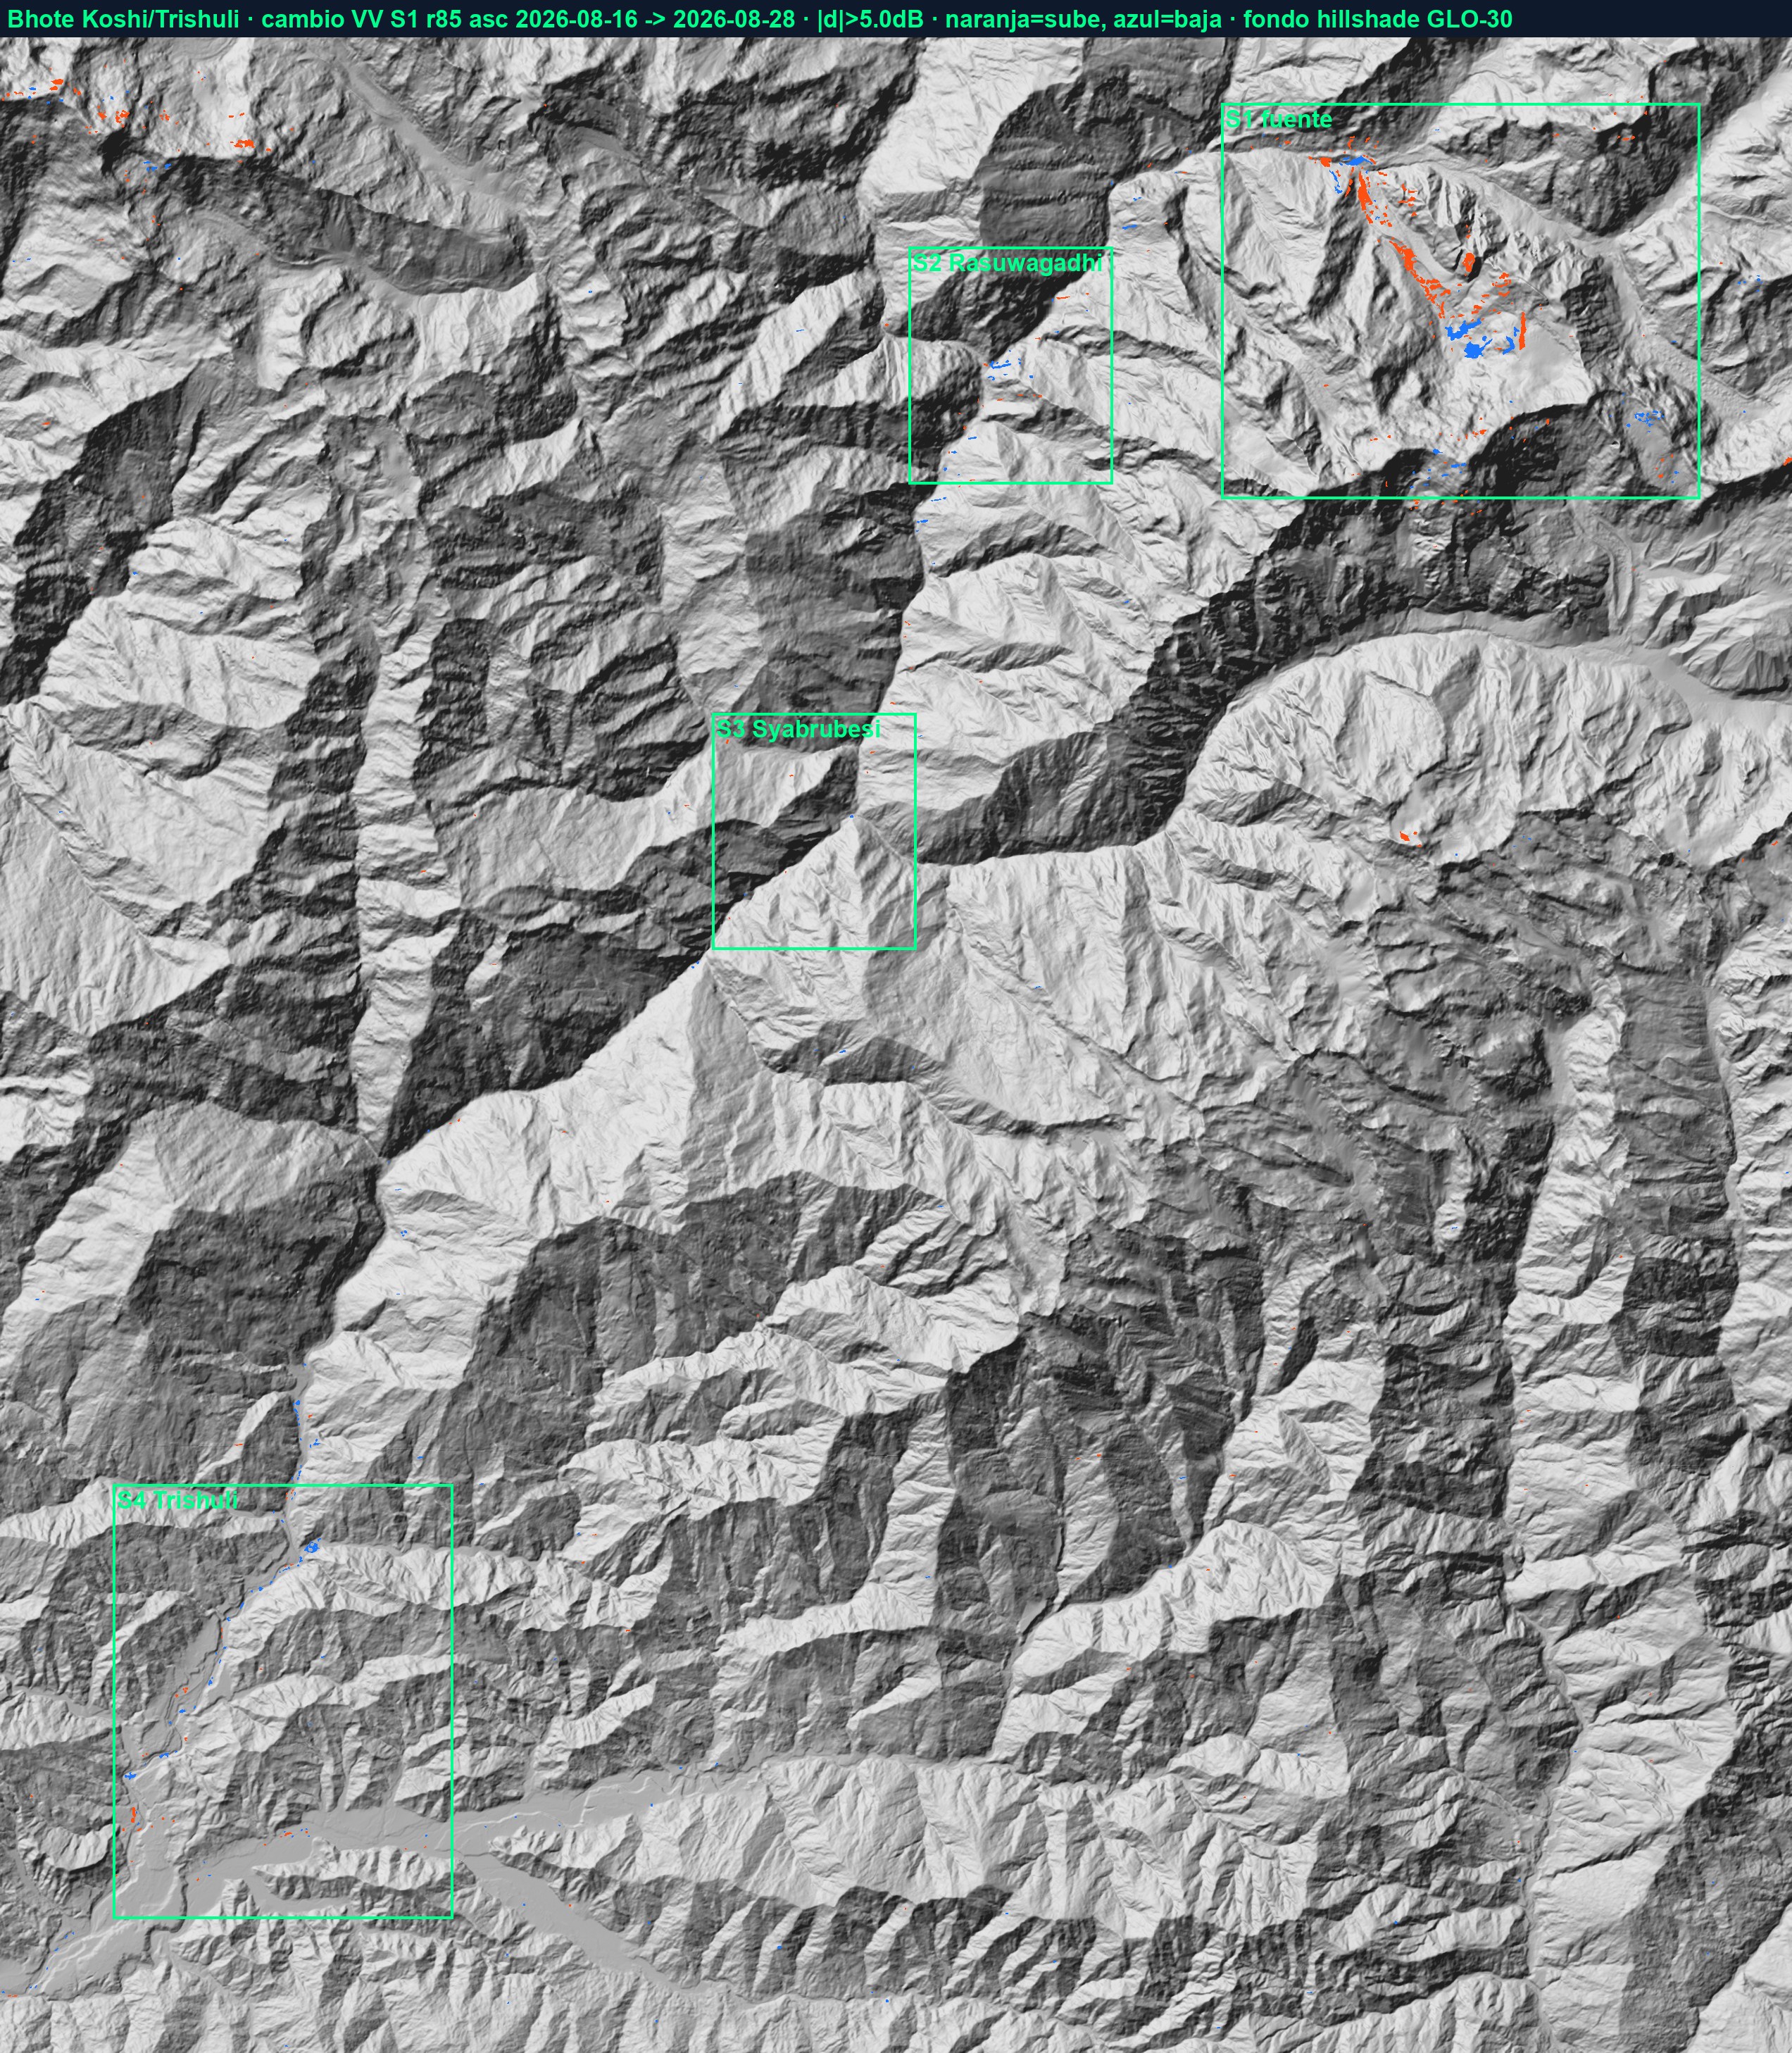
| Reach | Radar pair | Disturbance (ha) | % of area |
|---|---|---|---|
| Source zone (Lirung / Lhende Khola) | r85 · 16 → 28 Aug | 339.0 | 2.17% |
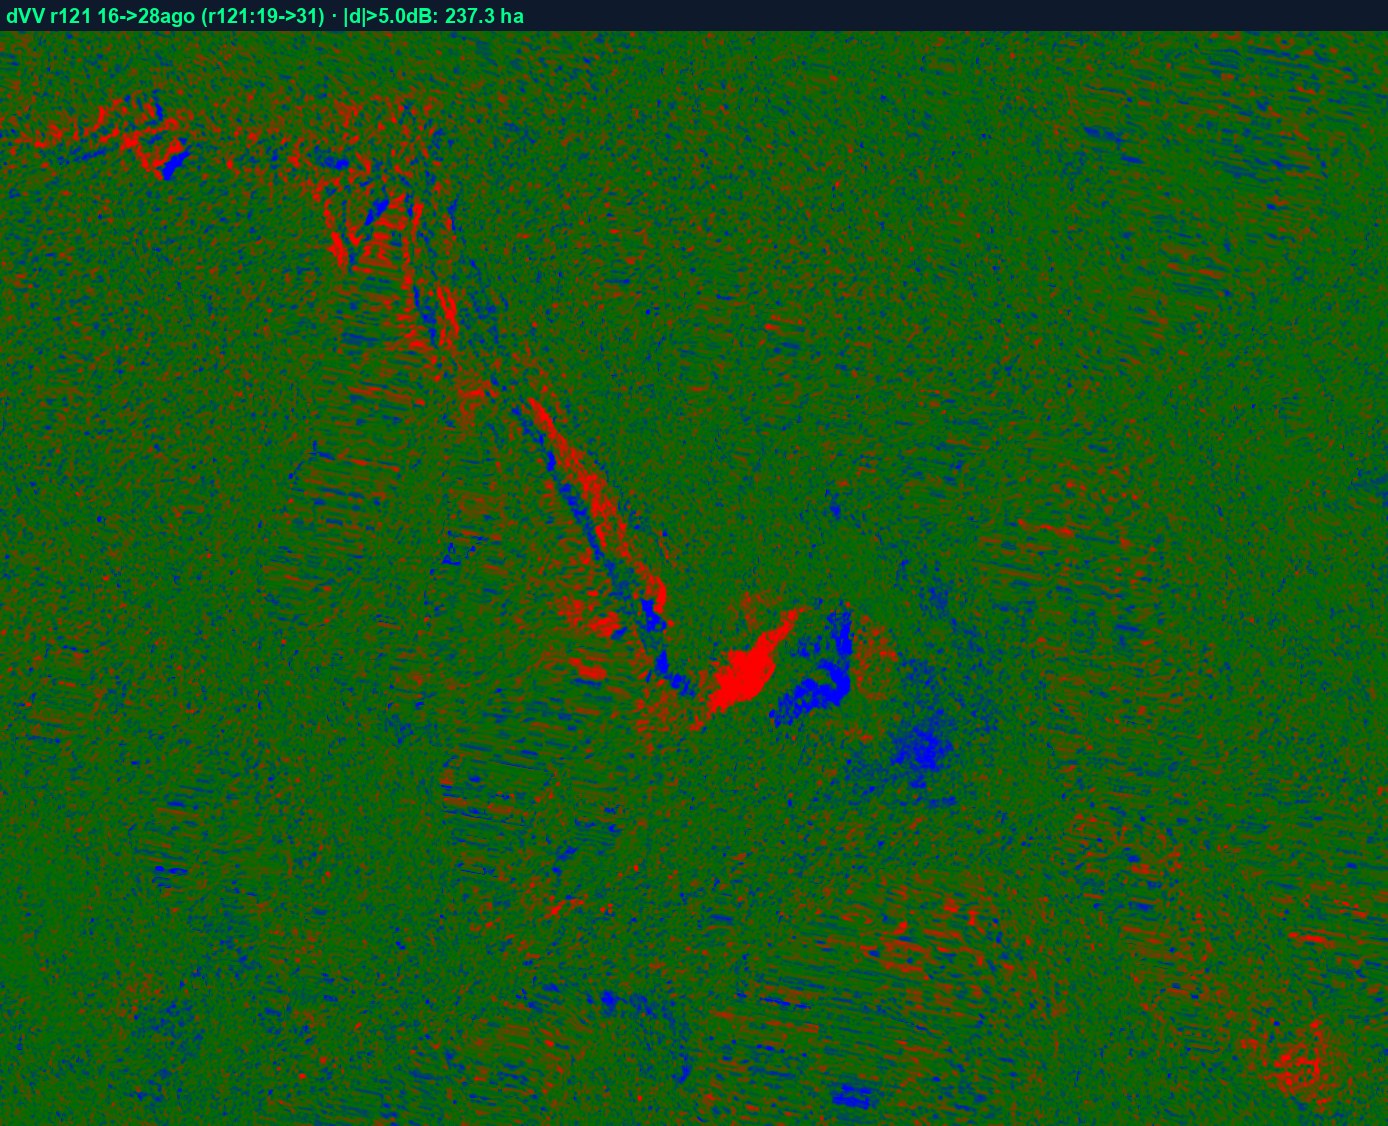
| Source zone — second geometry, independent | r121 · 19 → 31 Aug | 237.3 | 1.52% |
| Rasuwagadhi / Timure | r85 · 16 → 28 Aug | 43.0 | 1.07% |
| Syabrubesi (probable under-detection, see scope) | r85 · 16 → 28 Aug | 16.6 | 0.41% |
| Trishuli dams (downstream) | r85 · 16 → 28 Aug | 100.2 | 0.81% |
| East control (hillslope, no disturbance) | r85 · 16 → 28 Aug | 3.5 | 0.09% |
| West control (hillslope, no disturbance) | r85 · 16 → 28 Aug | 6.7 | 0.16% |
The source zone is measured over a clip of 15,629 ha (~14 × 11 km), covered at 100% by both orbits. Its signal is 9–24 times the background of the control zones (1.52–2.17% vs. 0.09–0.16%), and a second orbit with an independent observation geometry confirms it in magnitude. The fine spatial detail does not match between orbits (intersection 41.3 ha over union 535.0 ha): at 4,000–5,500 m each geometry sees different hillslopes due to shadow and layover, and the pairs cover different days. For this reason the range 237–339 ha is reported, not a single number or a pixel-by-pixel map.
There is still more water — channel widening and/or new ponded bodies
NDWI over clean pixels in both dates (declared common denominator for each figure). At Rasuwagadhi/Timure water goes from 45.6 ha (12 Aug) to 154.1 ha (27 Aug), and the second pair gives 209.9 ha (01 Sep) — six days after the event there was more water than the day after. Caution about chaining these three numbers as a single series: each pair has its own clean denominator (the PRE of the second pair is 43.5 ha, not 45.6). At the Trishuli dams, from 225.6 to 446.5 ha (12 → 27 Aug). The new water forms a continuous strip following the channel, not isolated patches: the signal is real, not classification noise. Its physical interpretation, however, is not unique: part is channel widening and part may be ponding behind debris — NRSC/ISRO reported a new lake of 19 ha against a hillslope in Rasuwa and another body of ~11 ha in the Trishuli bed, and treats them as hazards to monitor. Water that persists and grows is, in either interpretation, a watch signal, not a sign of normalisation.
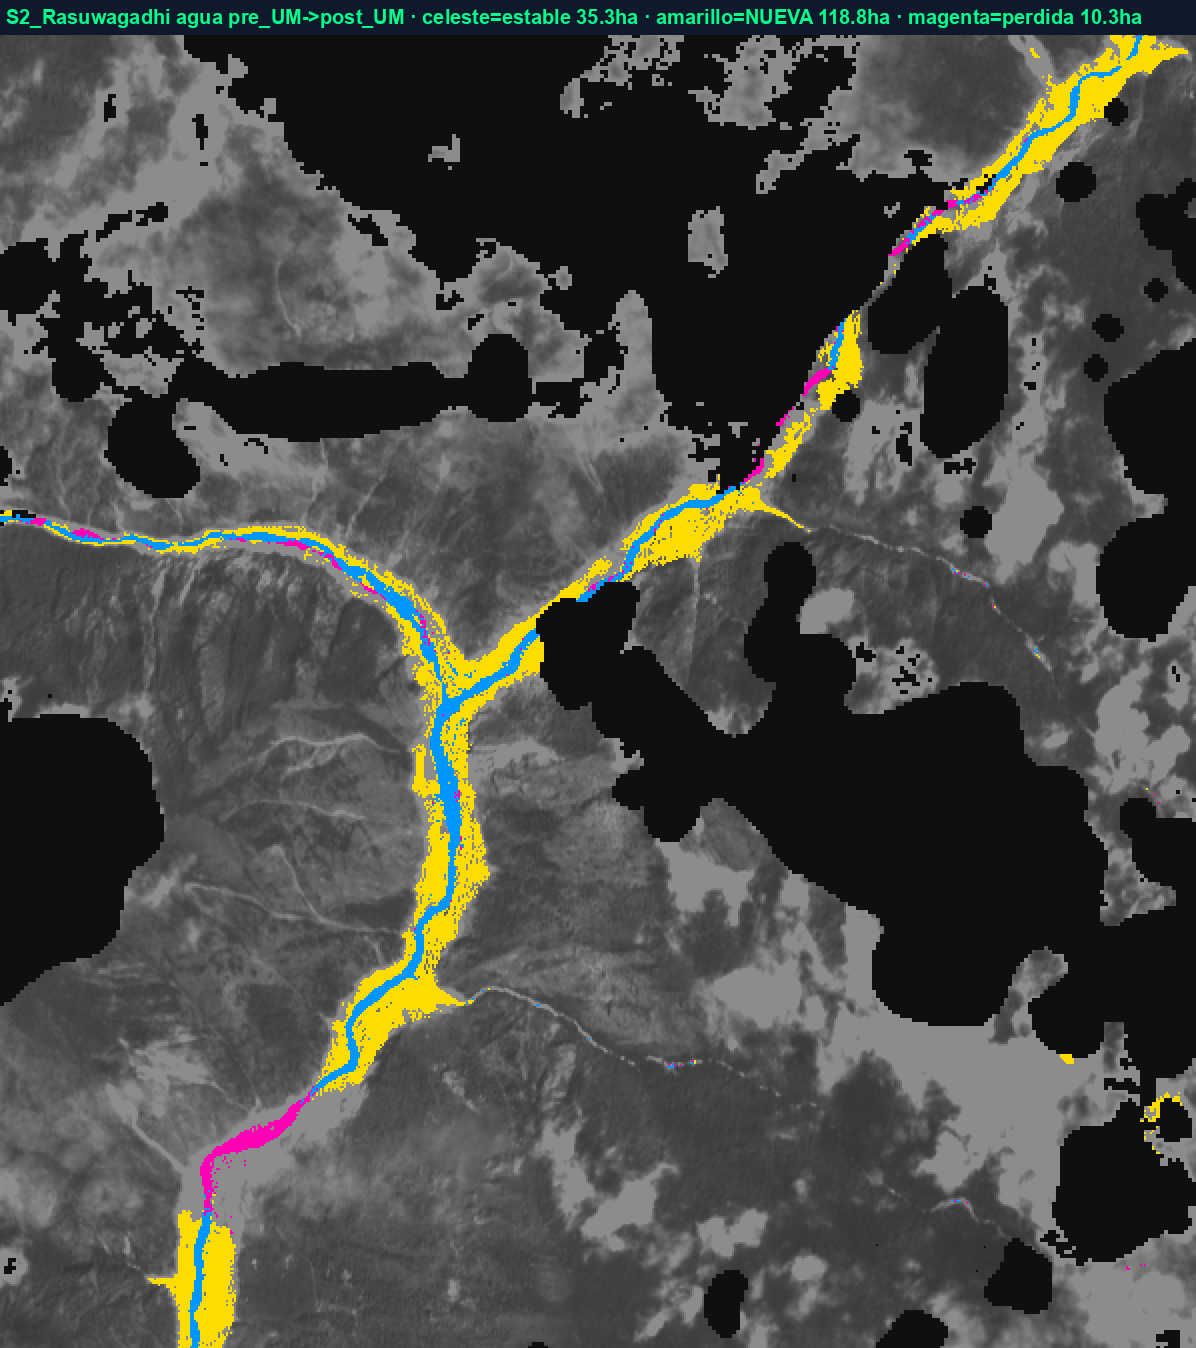
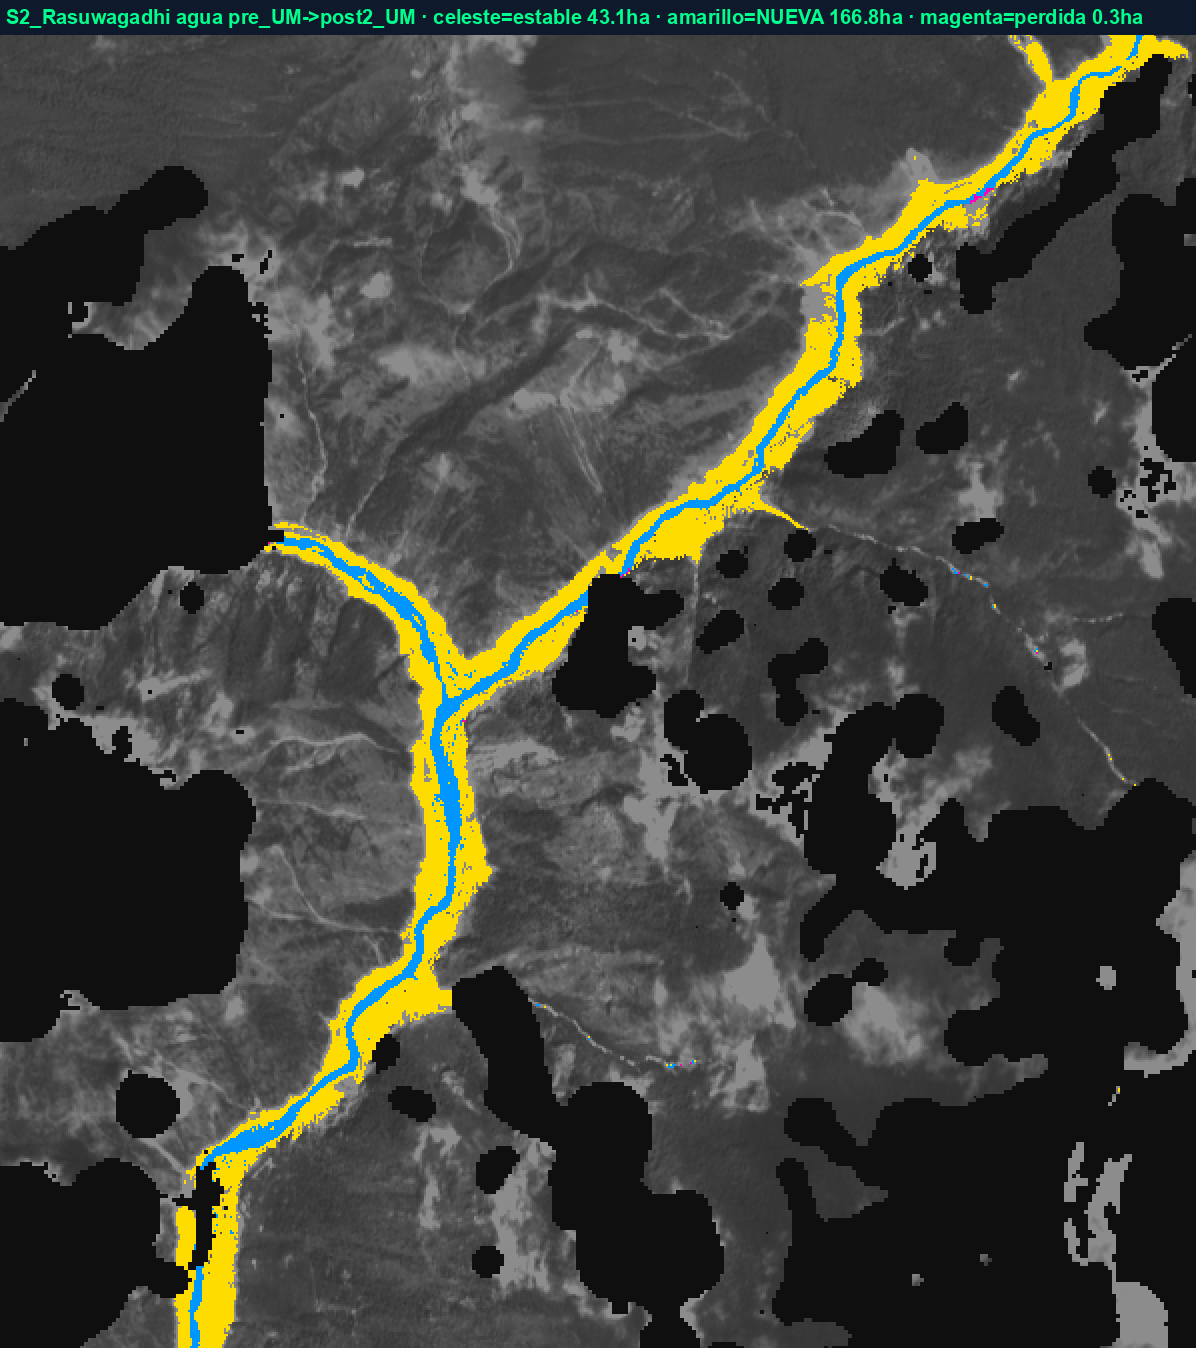
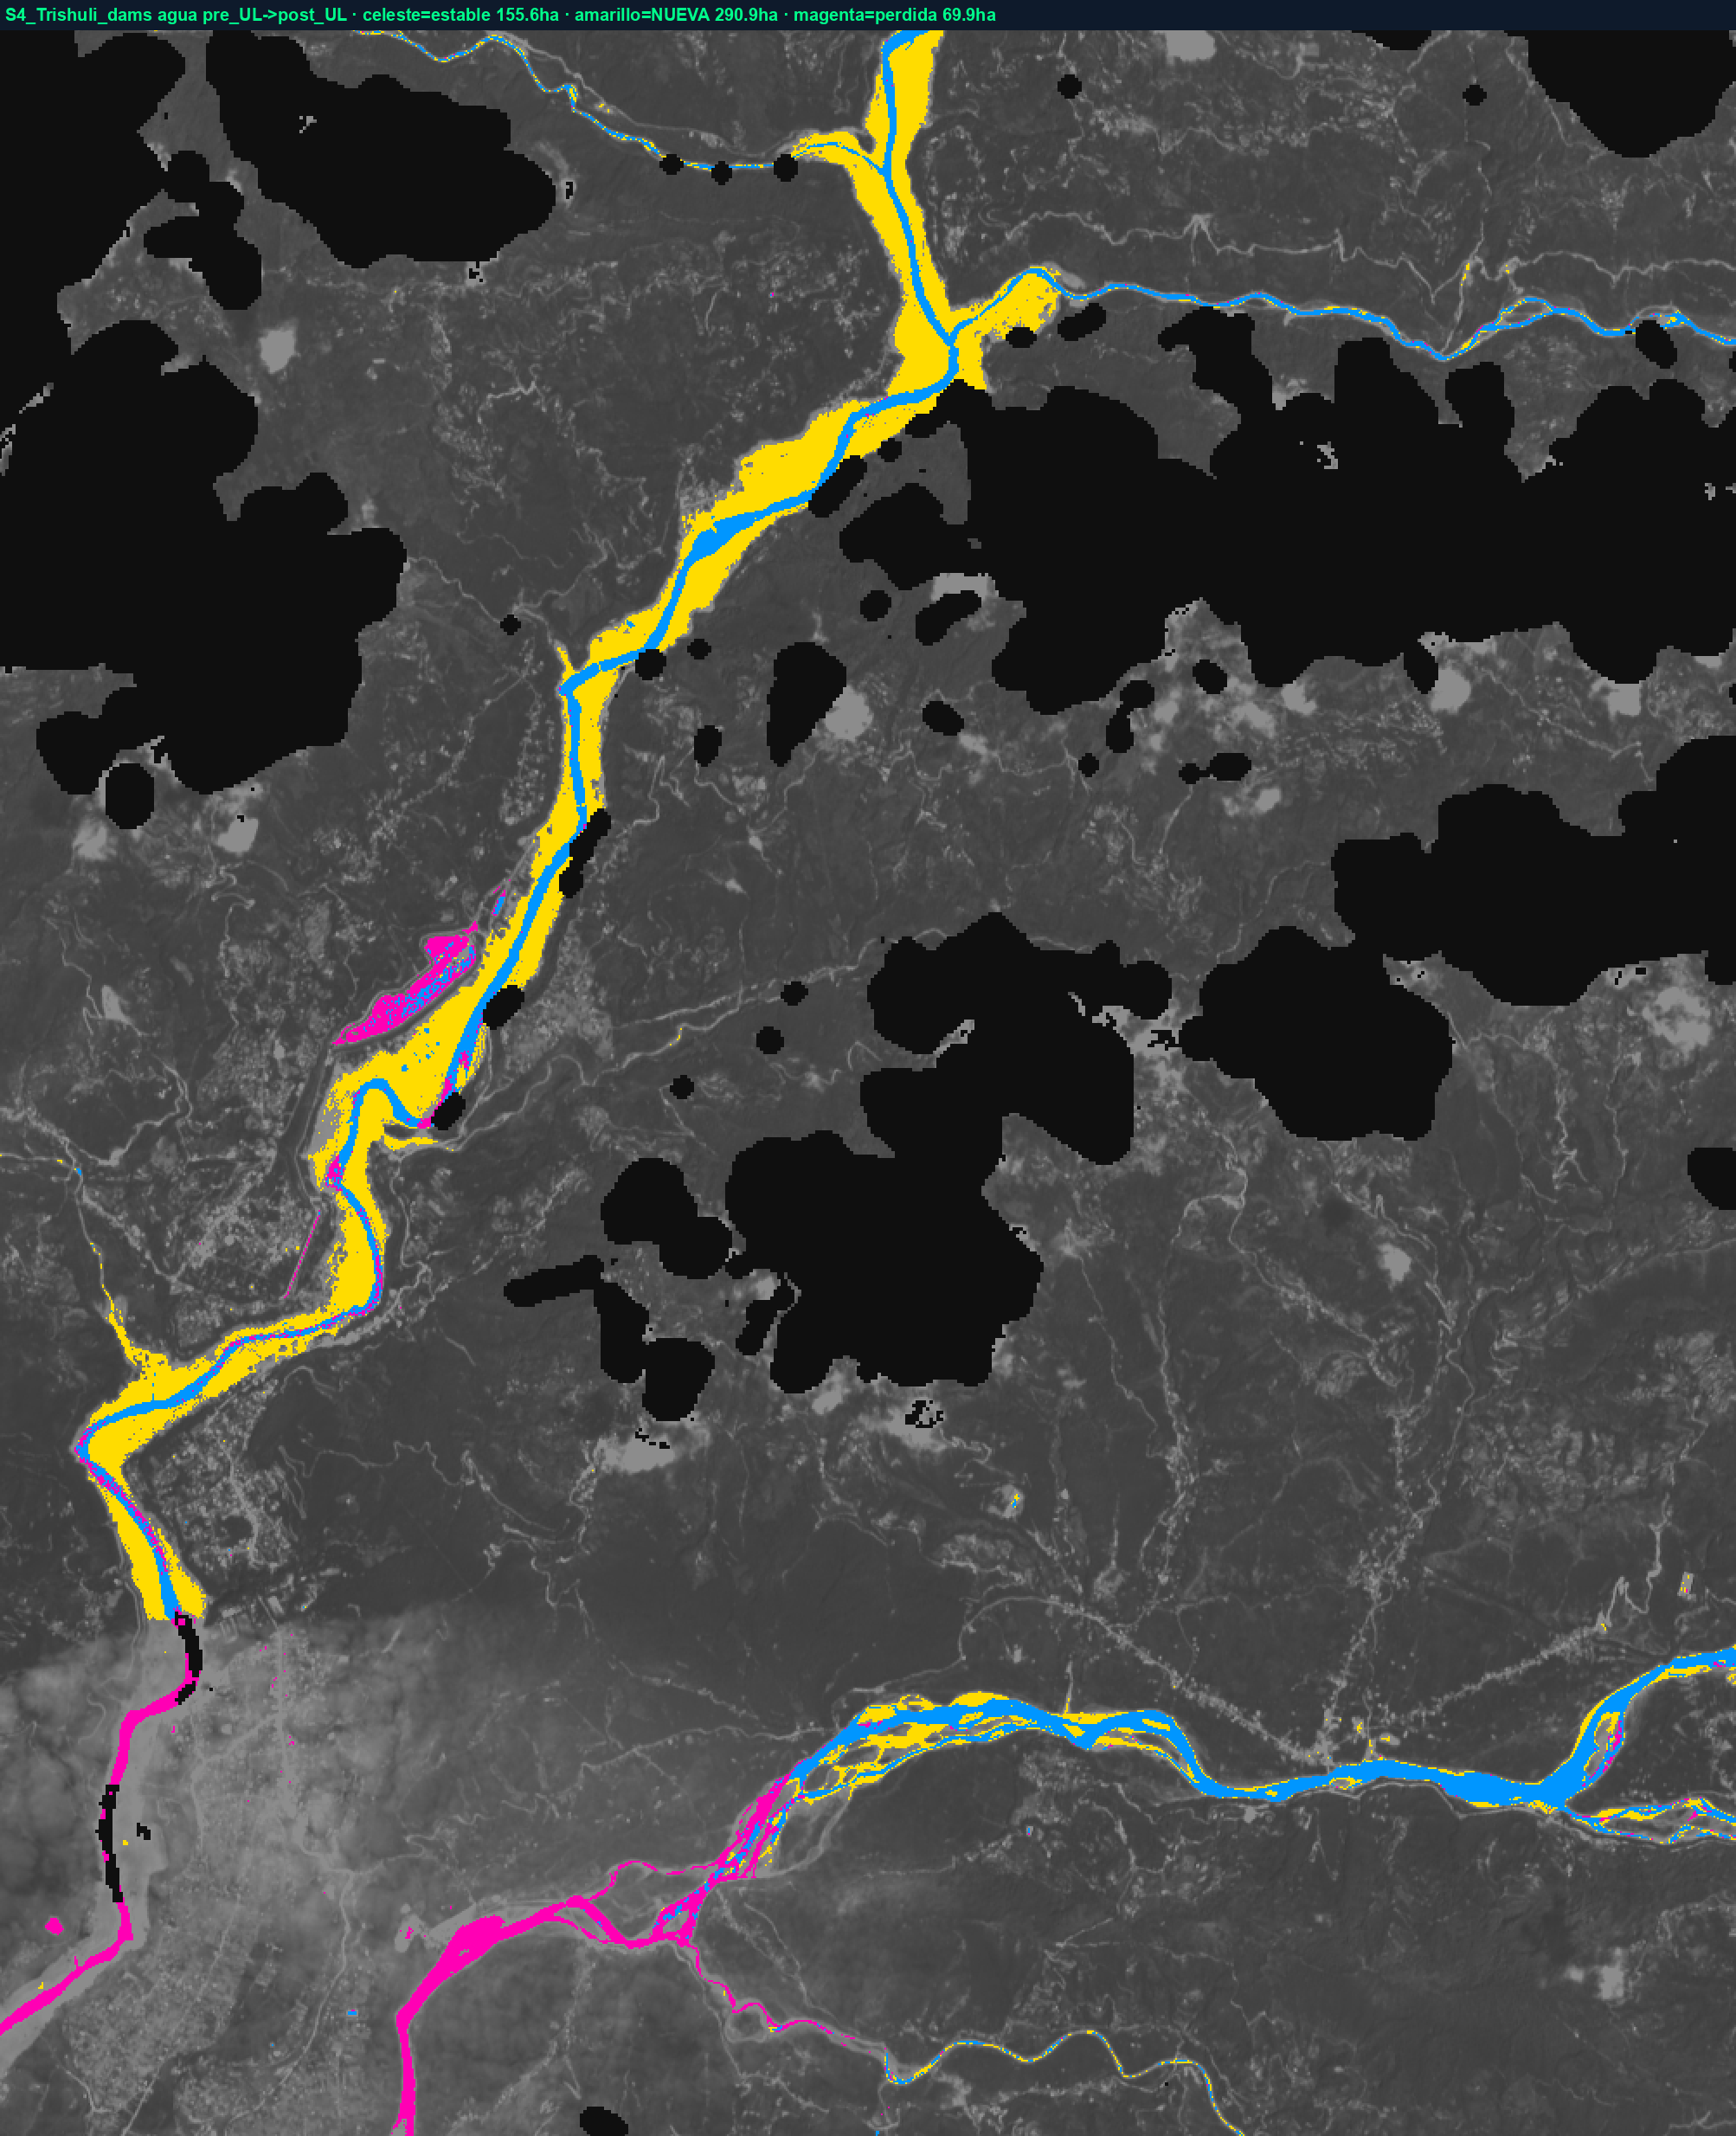
The figures are over the clean common denominator of each pair, not over the full AOI: with 20–30% cloud in the POST scenes, the actual new water may be larger, not smaller. In a flooding river, NDWI can include saturated bank margins: the widening is real (continuous strip), the exact hectarage carries that edge ambiguity.
From dark green to milky grey
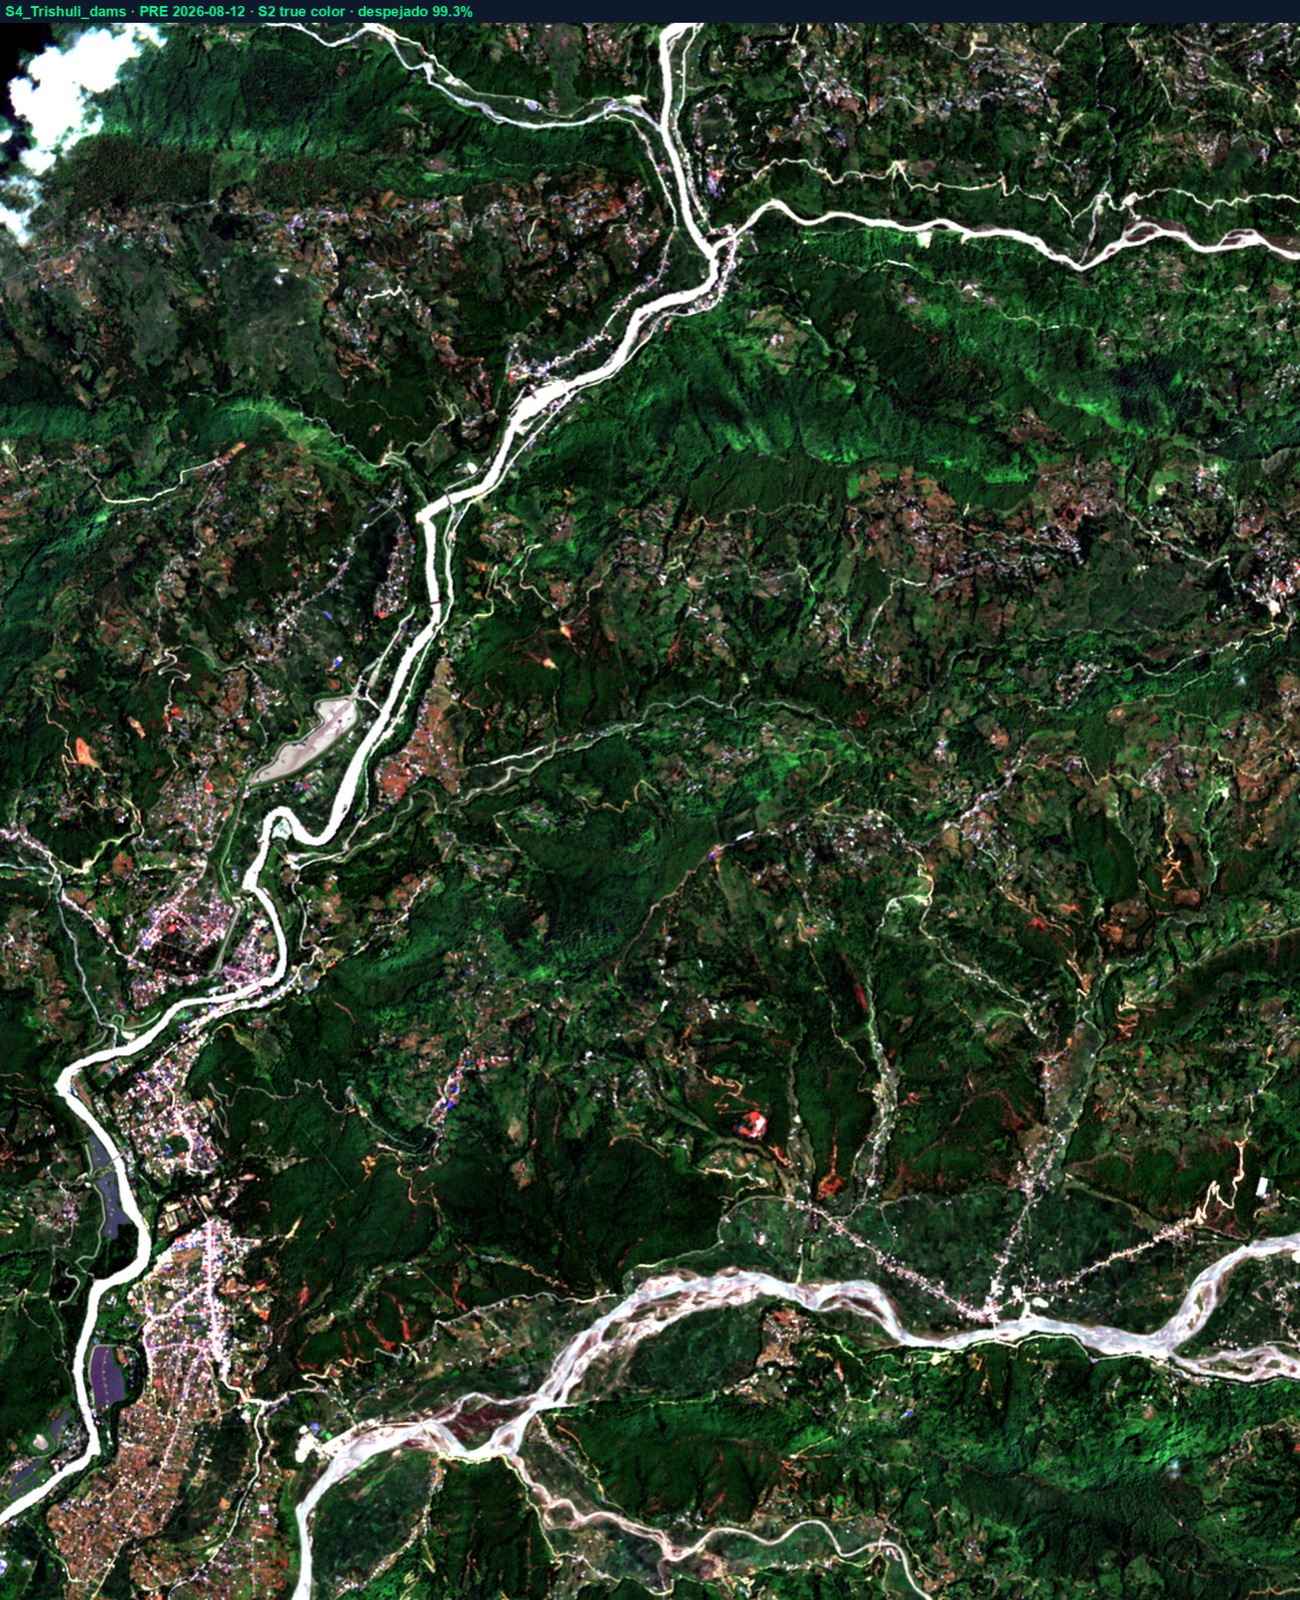
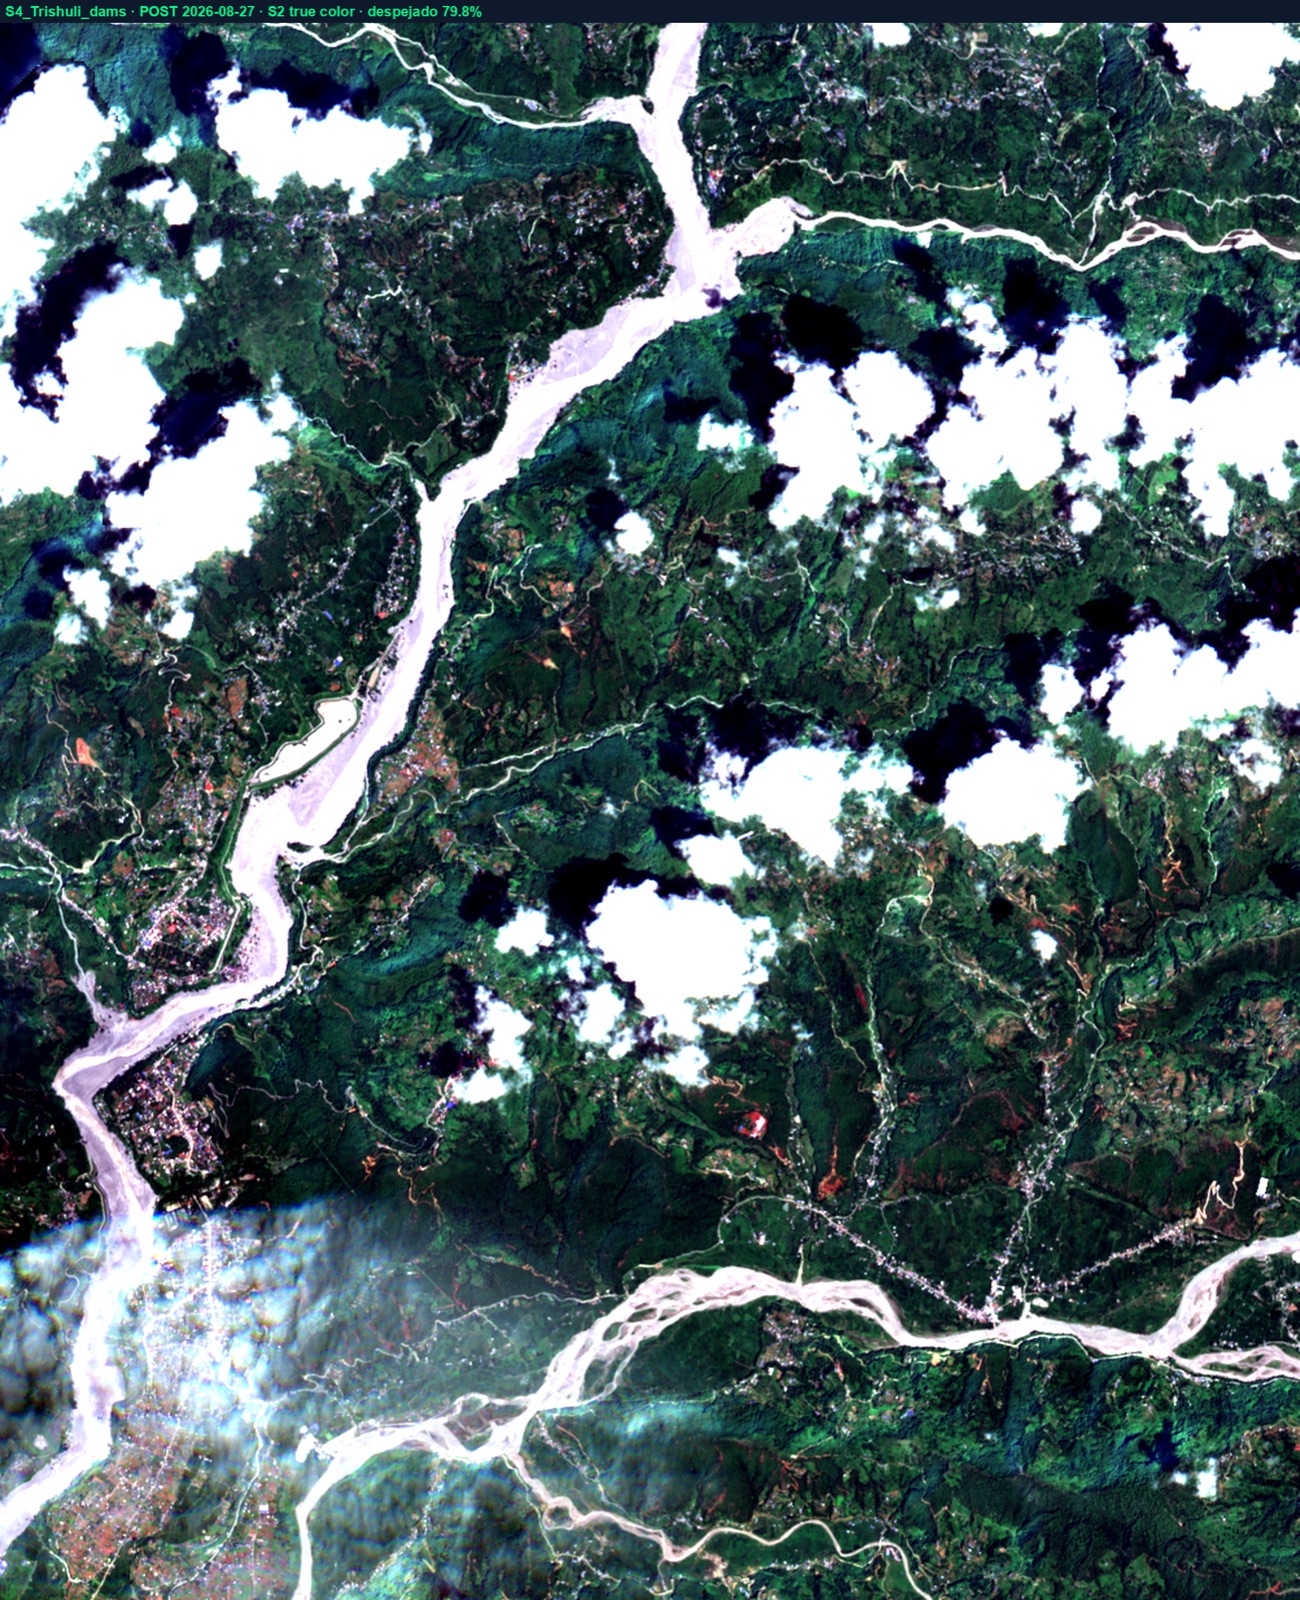
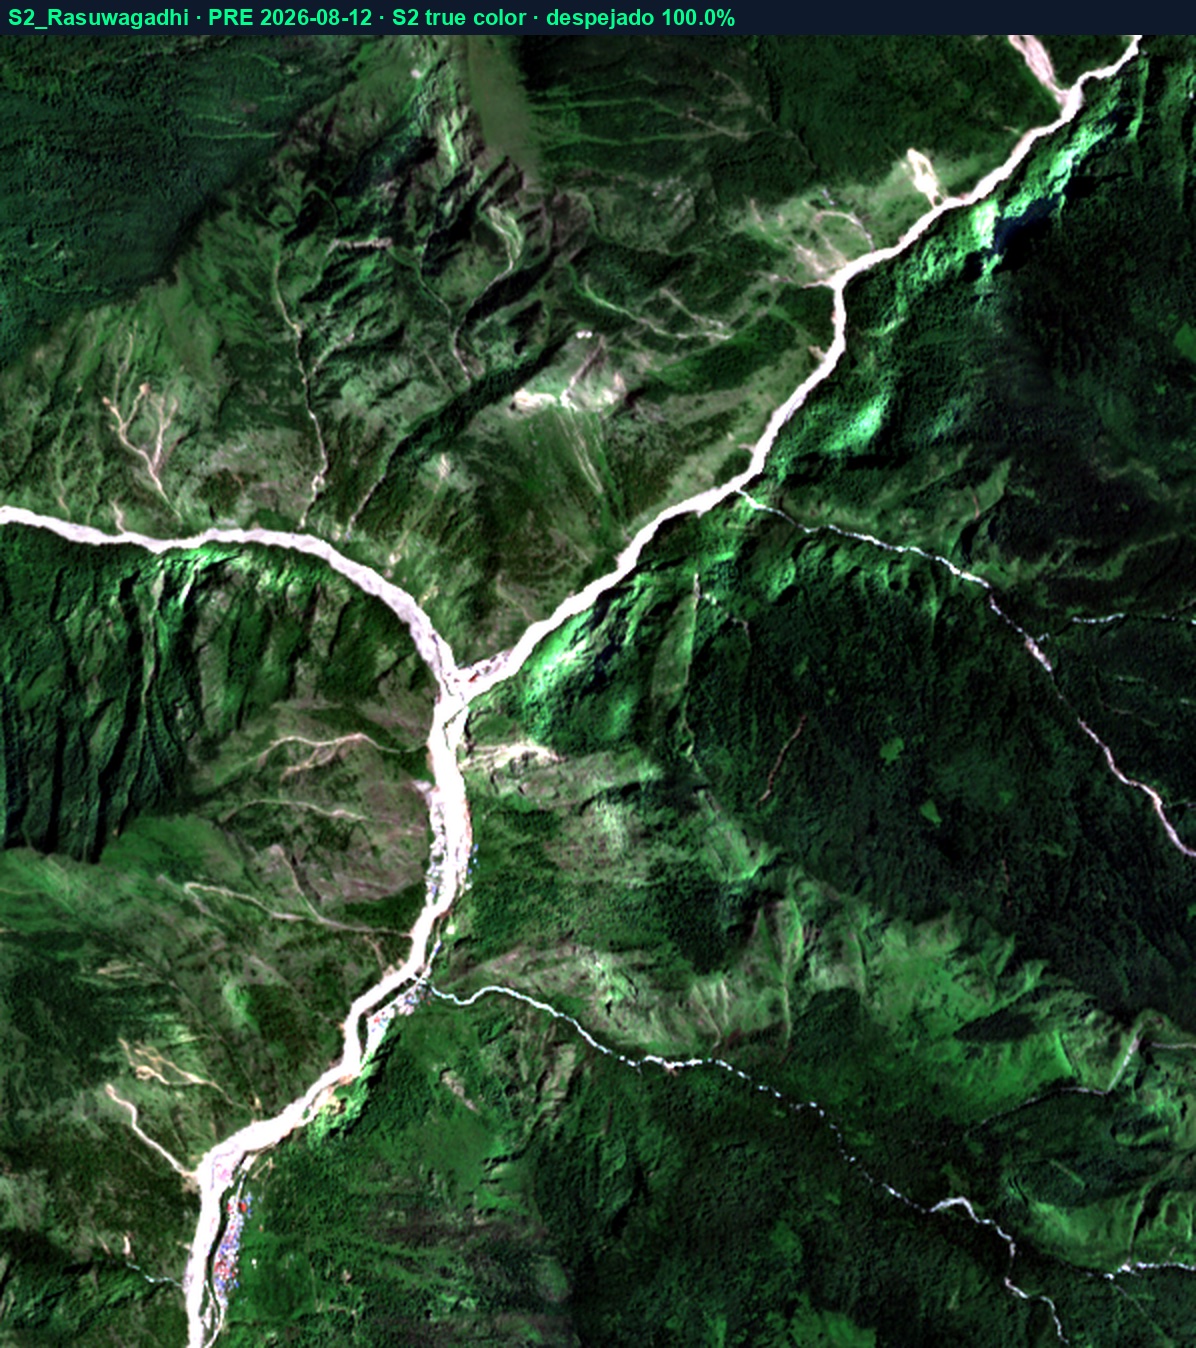
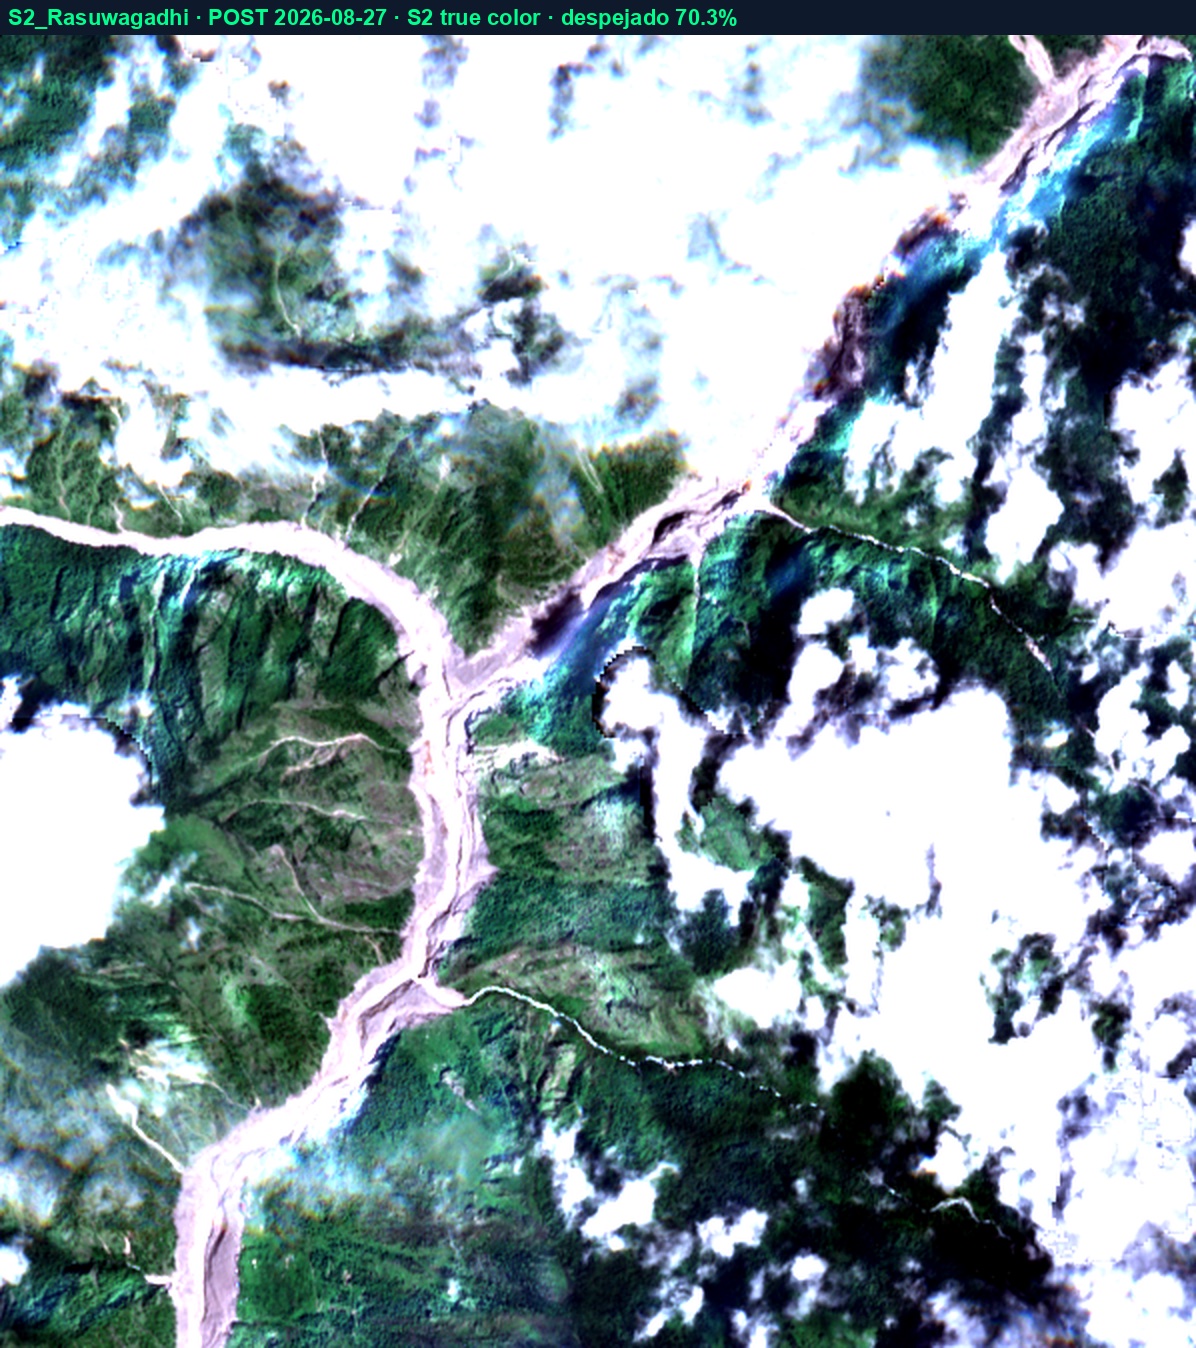
True-colour Sentinel-2, same orbit, fifteen days apart. The Trishuli goes from dark green to milky grey, with fresh bright deposits on the banks. Measured over water common to both dates, NDTI (turbidity proxy) rises at both sites and in all pairs: Trishuli dams −0.005 → +0.013 (12 → 27 Aug, 155.6 ha common) and Rasuwagadhi 0.007 → +0.023 (12 → 27 Aug, 35.3 ha common) and 0.005 → +0.017 (12 Aug → 01 Sep, 43.1 ha common). The directional indicator is NDTI: at Rasuwagadhi the red channel (B04) falls slightly because the common PRE water included foam and very bright rapids.
The source: our firmest evidence is the radar
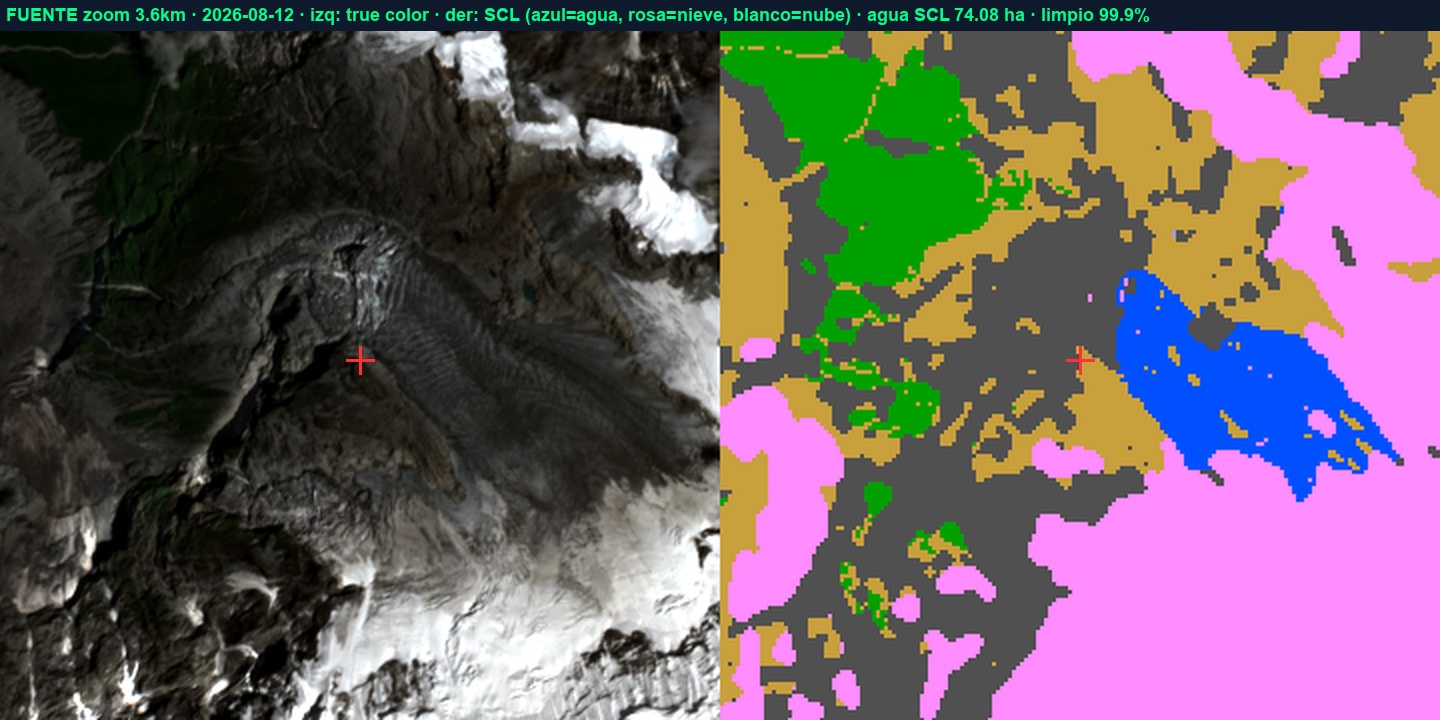
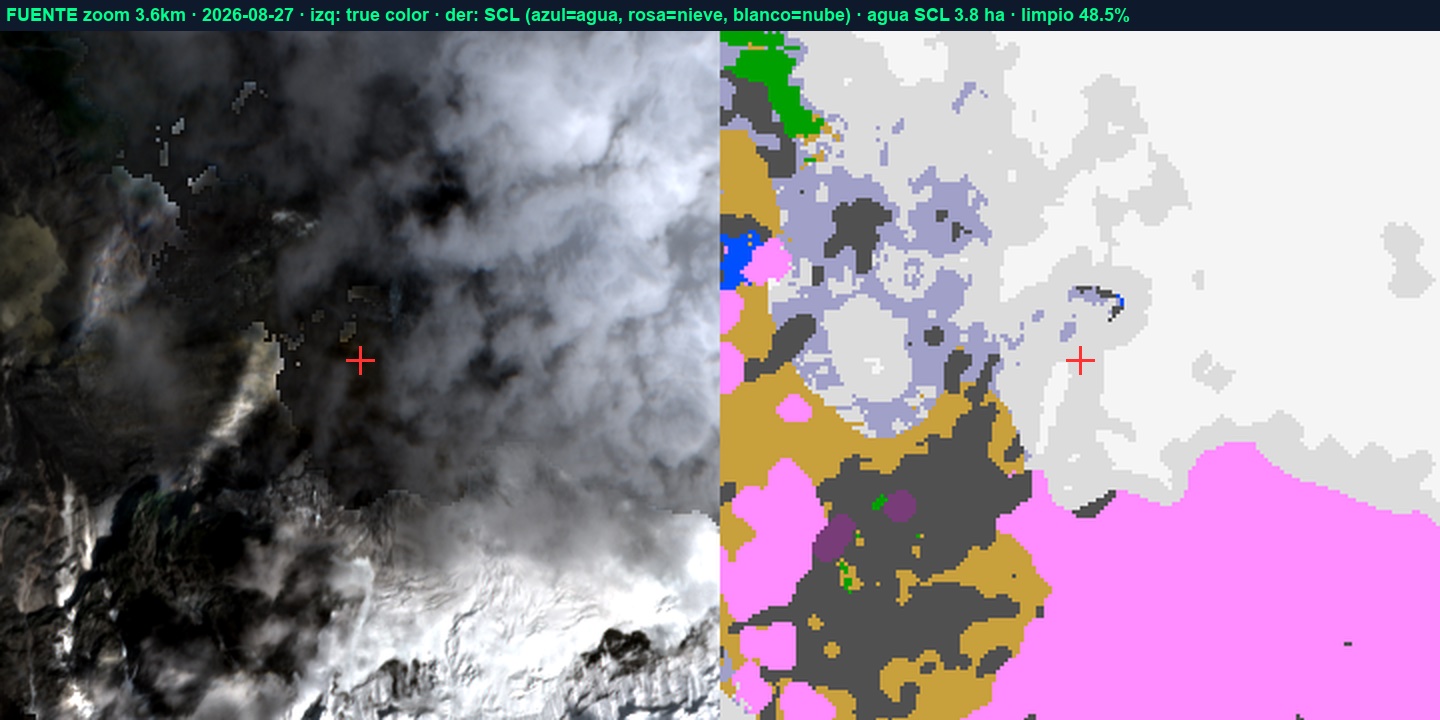
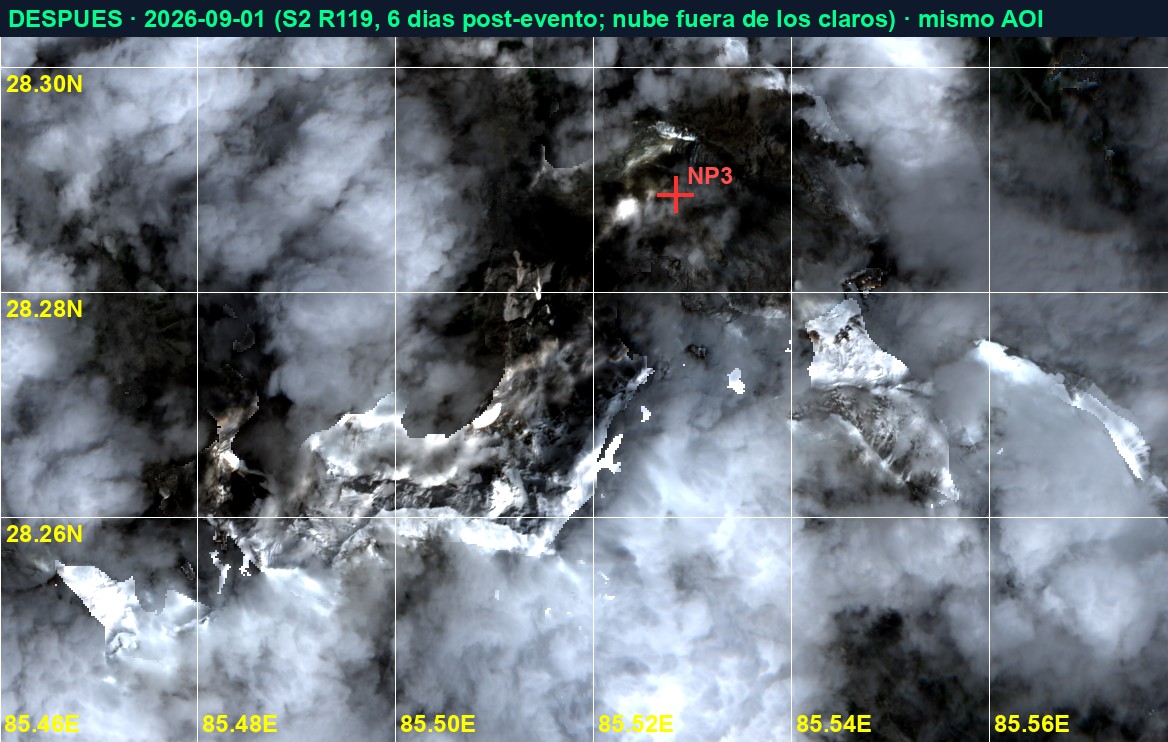
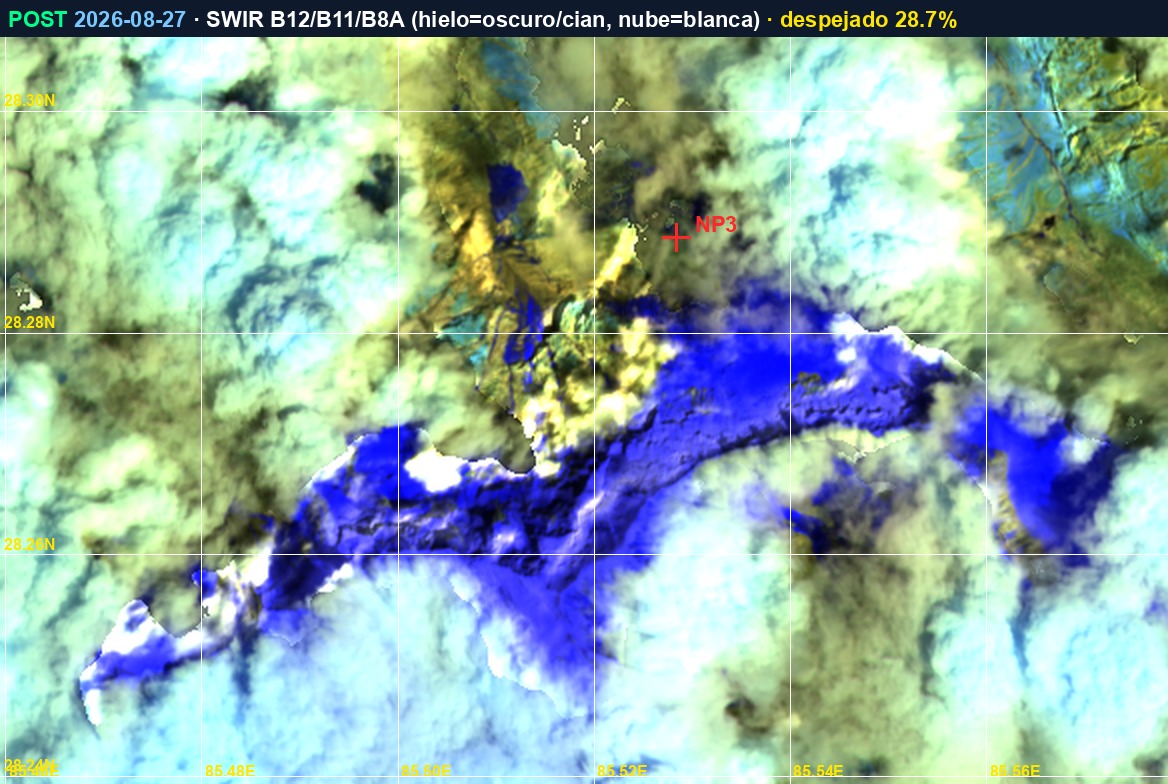
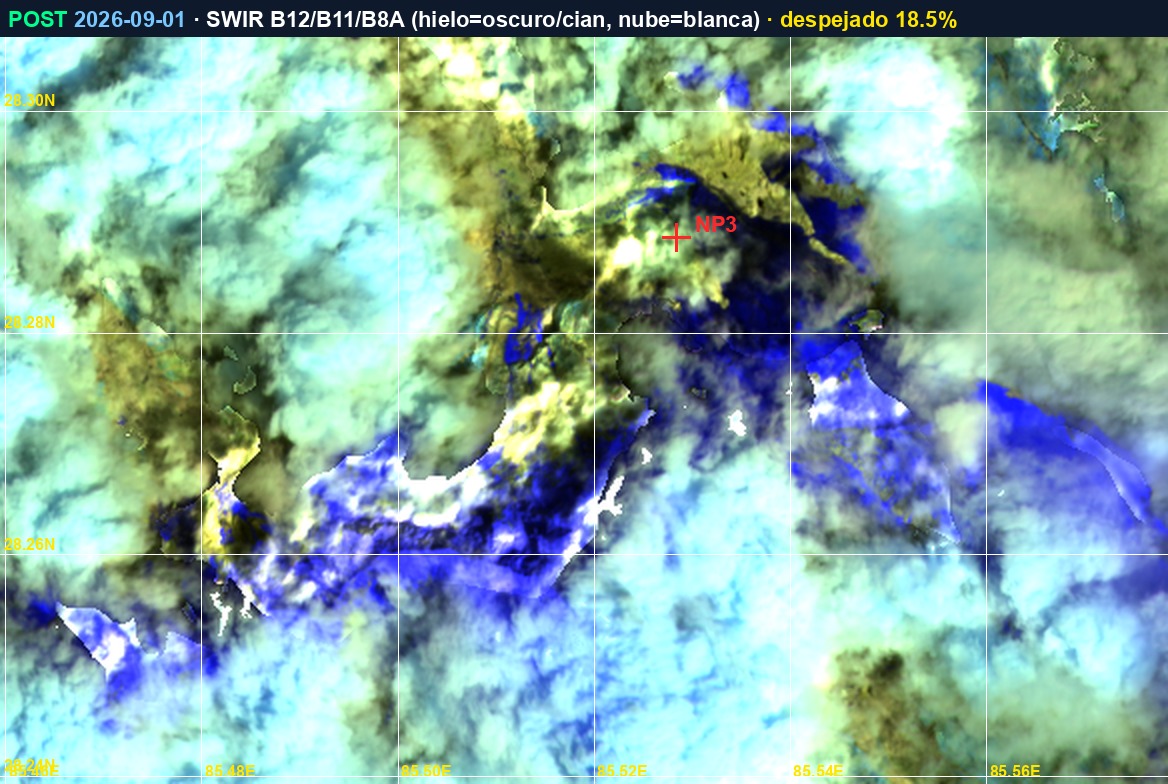
In the 3.6 km clip around the point reported by NP3 (28.2887° N · 85.5282° E), the optical POST was 48.5% clean on 27 Aug and 44.7% on 01 Sep, with the point itself under cloud or shadow on both dates. Through the clear gaps a tan-coloured debris field is visible on the hillslope and valley floor where the PRE showed dark rock and ice — visible, but not delimitable or measurable. Quantification of the source rests on the radar (table above: 237–339 ha by orbit).
The source glacier, against the official catalogue
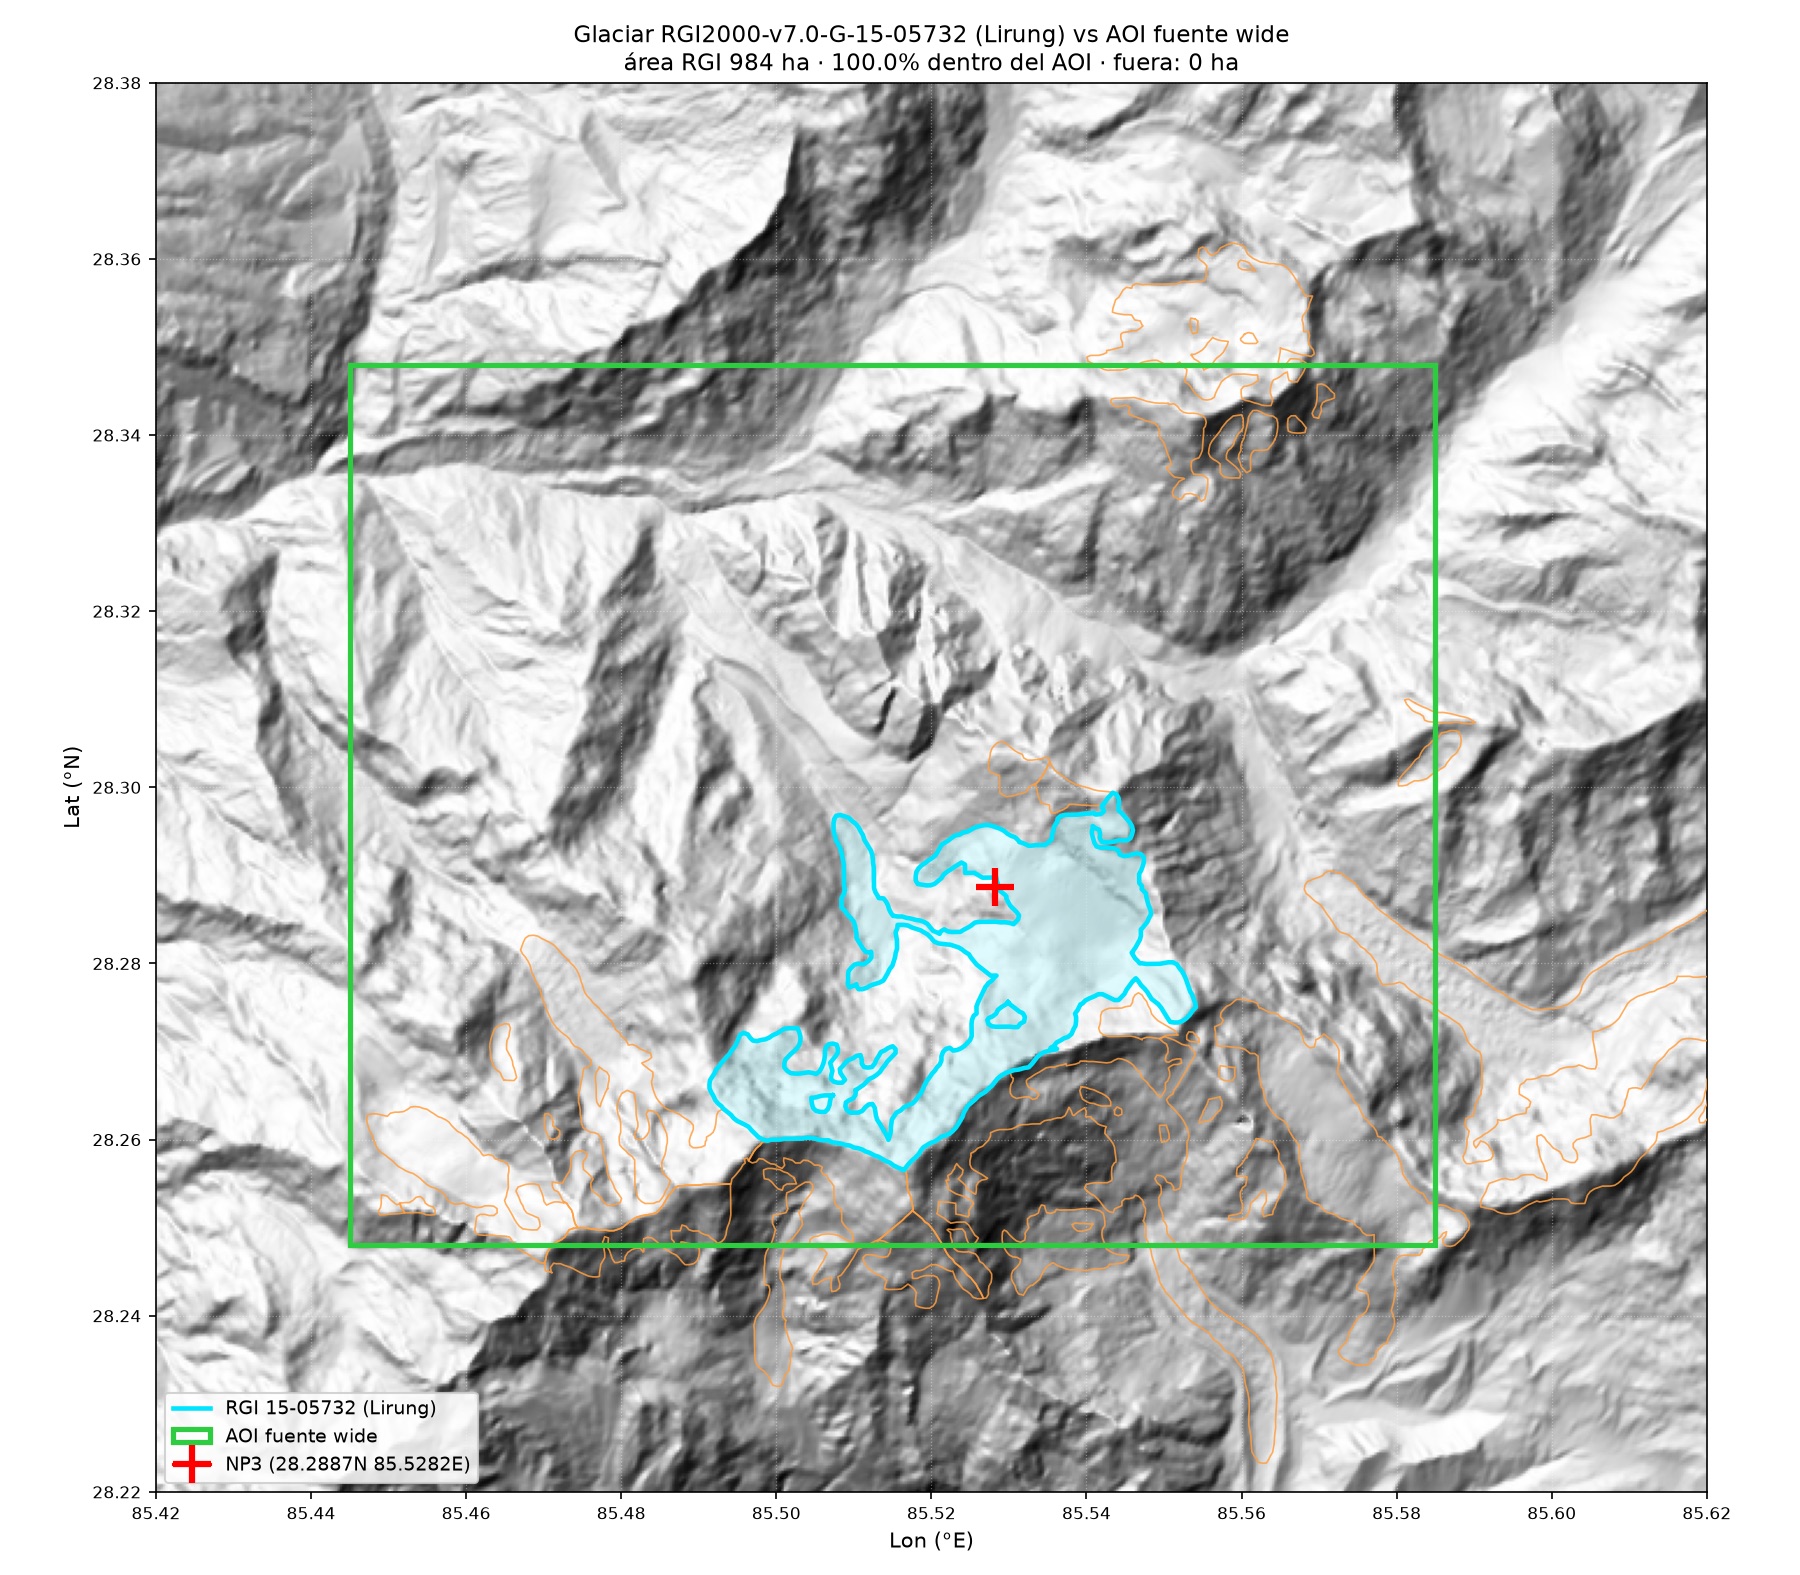
Before measuring the glacier one must know which it is and where it ends — and that is not drawn by eye: it is taken from the global catalogue. In the Randolph Glacier Inventory 7.0 the source glacier is listed as RGI2000-v7.0-G-15-05732 (GLIMS G085538E28285N): 984 ha, between 3,638 and 7,200 m altitude. In the catalogue it appears without a name; "Lirung" is the designation used in the NP3 report (HiRISK/ICIMOD). The collapse point reported by NP3 (28.2887° N · 85.5282° E) falls within the official polygon, and the AOI of this analysis covers the glacier at 100% — verified by rasterising the official outline onto the measurement grid (988.2 ha inside, 0.0 outside).
The same frame, 20 months later
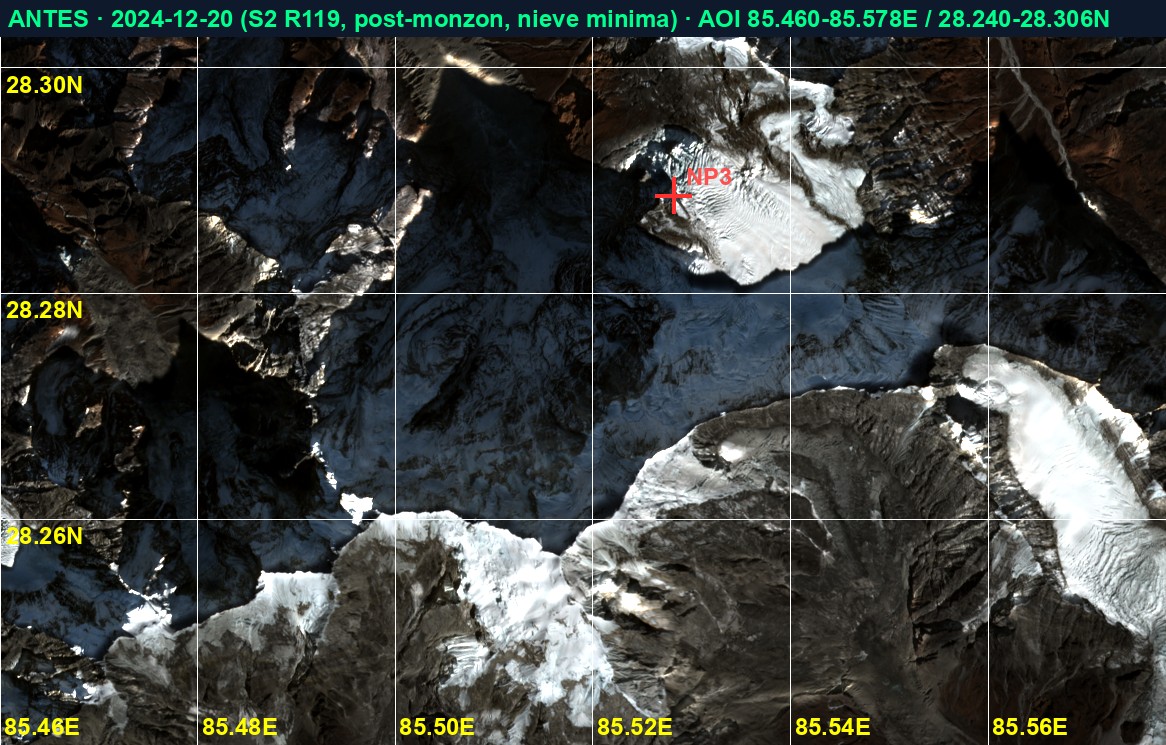
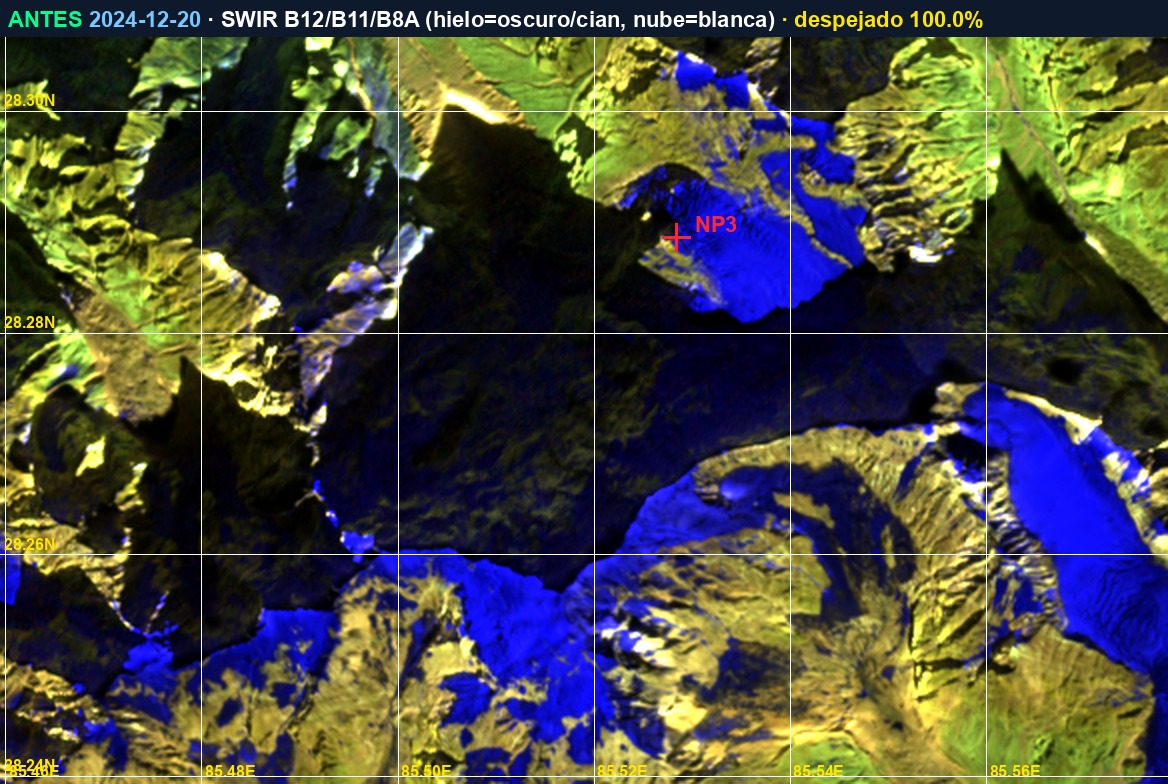
True-colour Sentinel-2, same orbit R119, same frame. As historical reference the best available scene was chosen: 20 Dec 2024, post-monsoon with minimal snow, 95.7% clean over the AOI, selected from 252 candidates scanned for actual cloud. The seasonality control is explicit: ice is present in Dec 2024 (winter) and in the PRE scene of 12 Aug 2026 — 14 days before the event, in peak summer —, and absent in the views of 01 Sep 2026. What is missing after 26 Aug is not the seasonal cycle.
Stable for years — fractured in twelve days
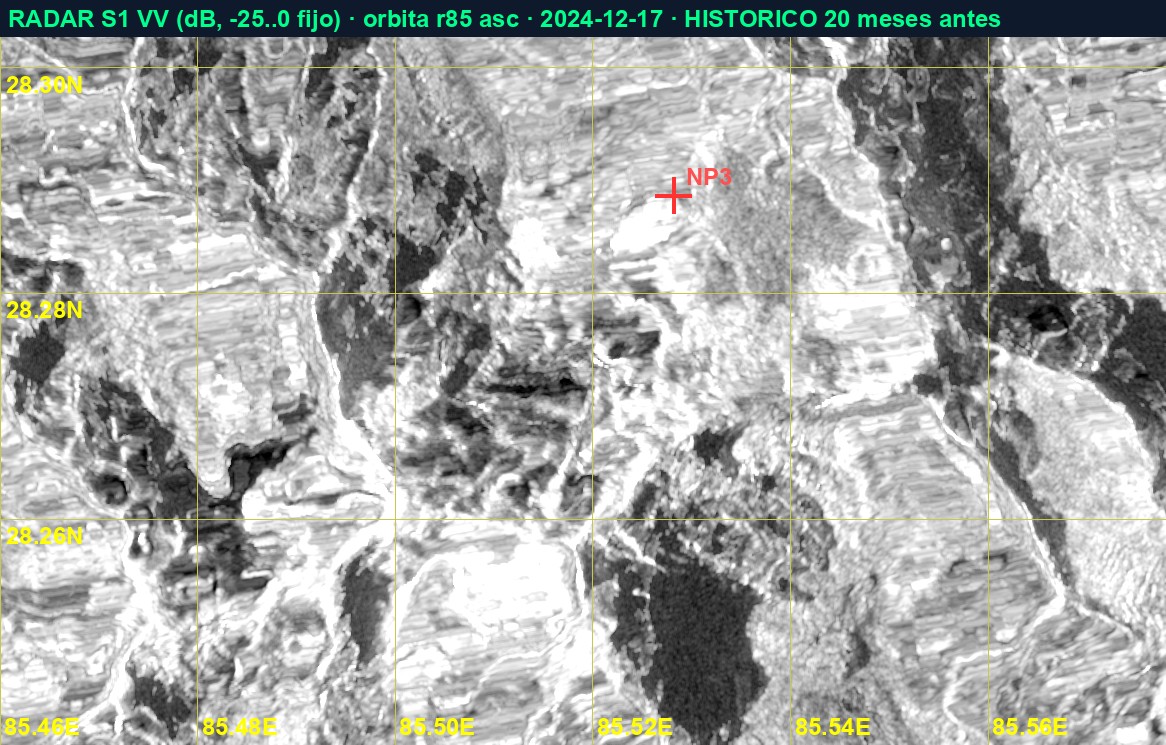
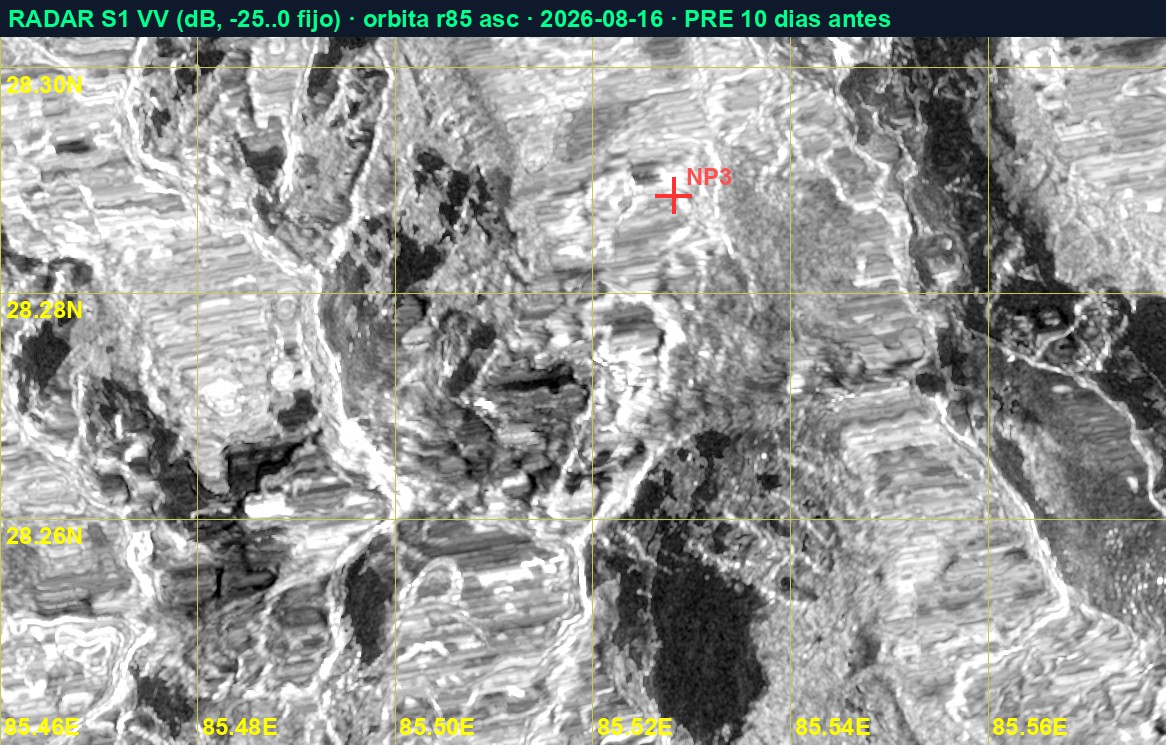
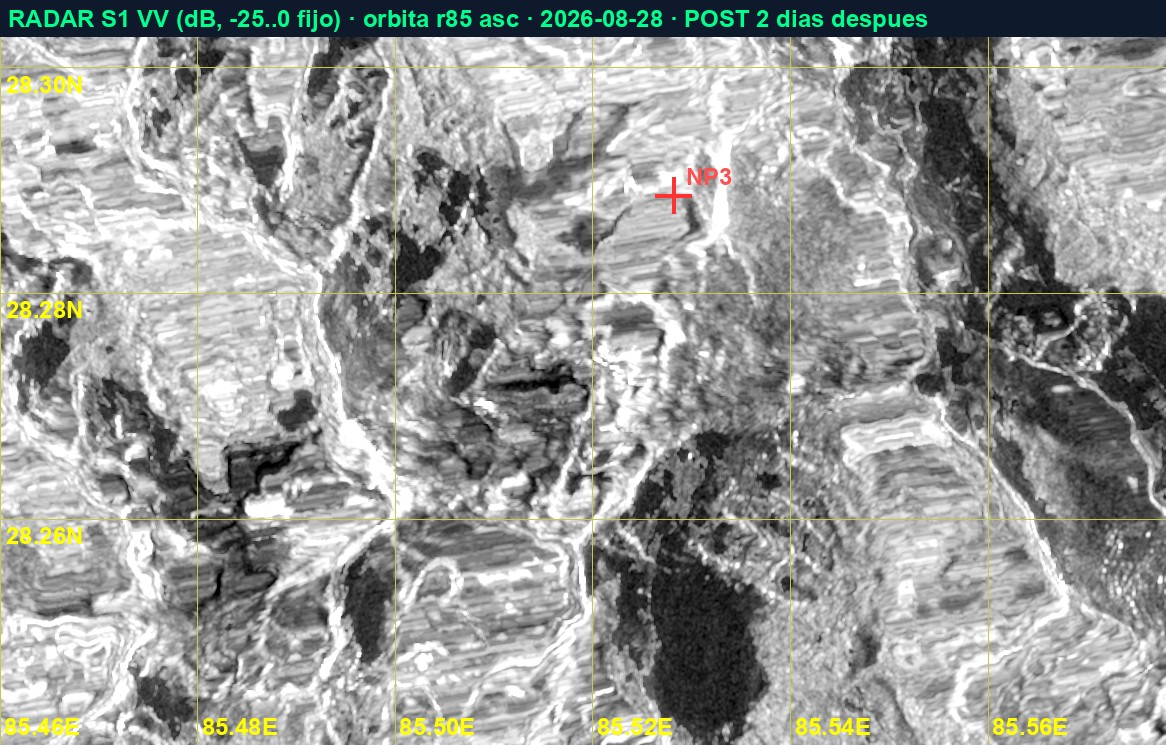
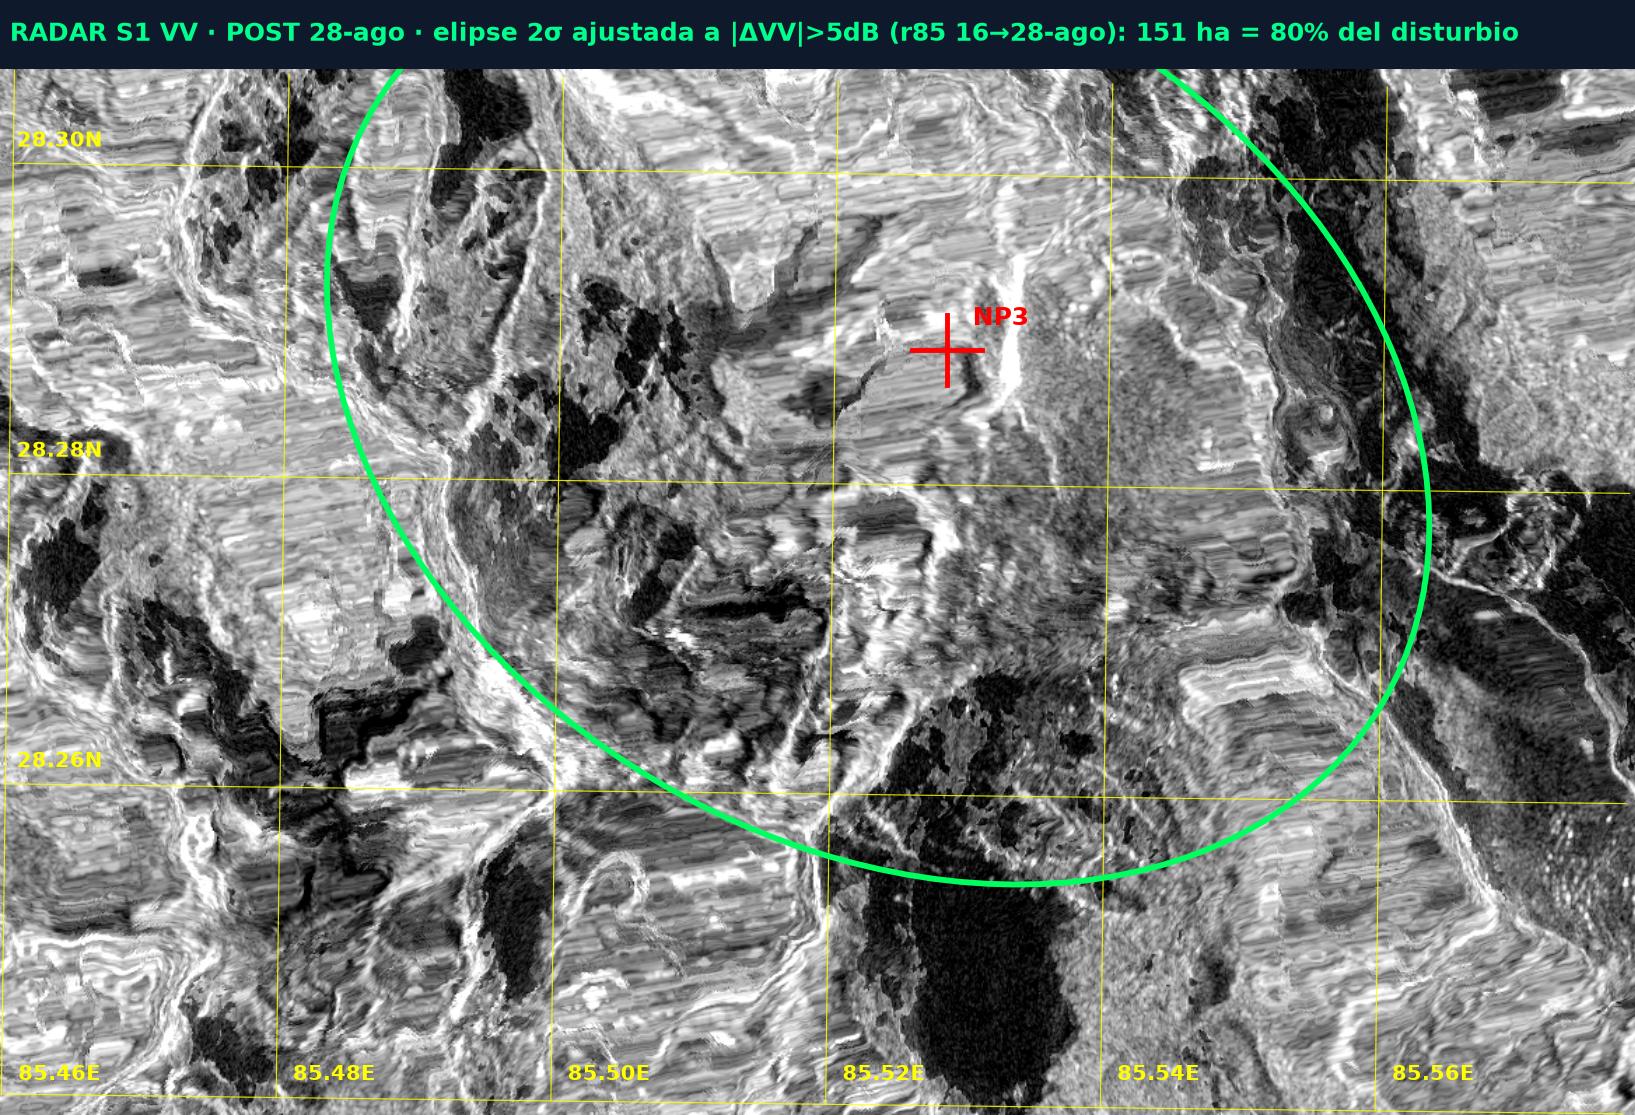
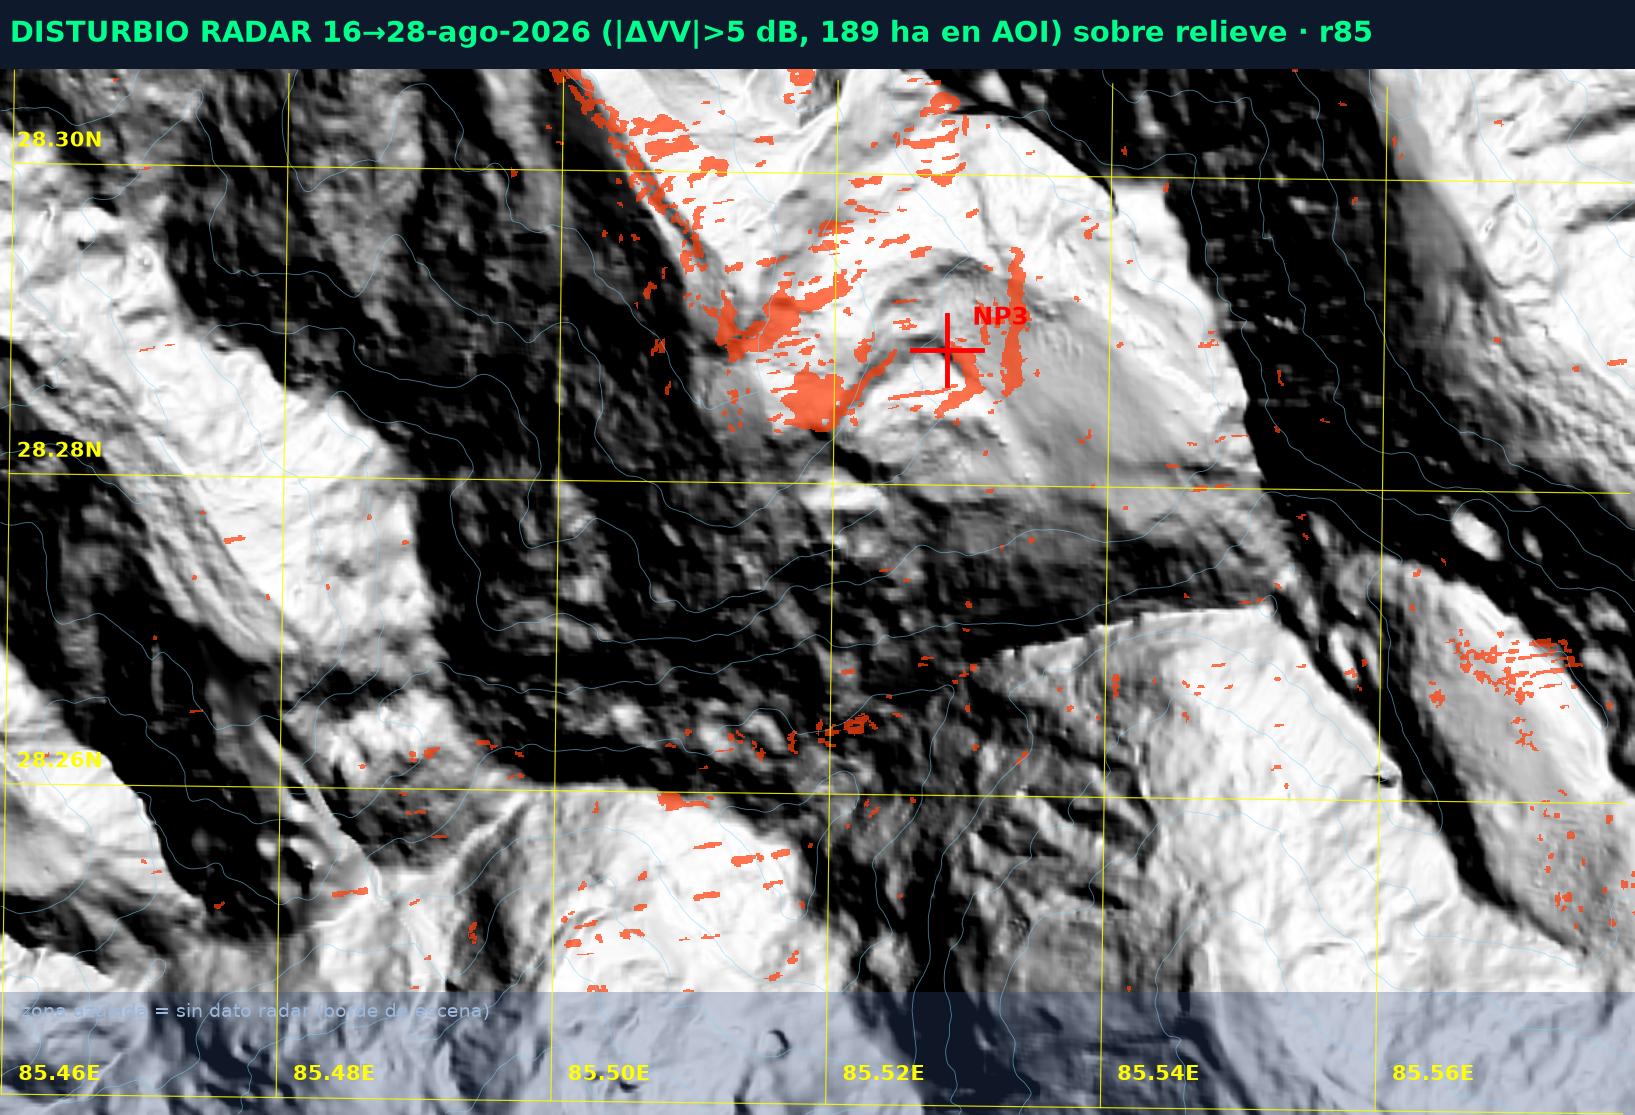
Three passes of the same orbit r85, which see the terrain with identical geometry and do not depend on clouds. The Dec 2024 and the 16 Aug 2026 passes — twenty months apart — are near-twins: at the scale of years, the surface seen by radar amplitude was stable. The caveat is explicit: amplitude does not see ice velocity or fine crevasses, and NP3 documents precursors days before the collapse (ice surface acceleration, brown meltwater from 24 Aug, a crack propagating to the bedrock). "Near-twin" does not mean "without precursors". The 28 Aug pass shows the surface fractured; the 16 → 28 Aug window integrates at least two collapses (USGS recorded a second avalanche, Ms 4.2, three hours after the first): the measured disturbance is the aggregate, not a single event. Over that pair, an ellipse fitted to the change clusters (|ΔVV| > 5 dB; centroid + covariance, 2σ) encloses 80% of the disturbance in the inset: 150.7 of 188.9 ha.
Infrared separates what the eye confuses
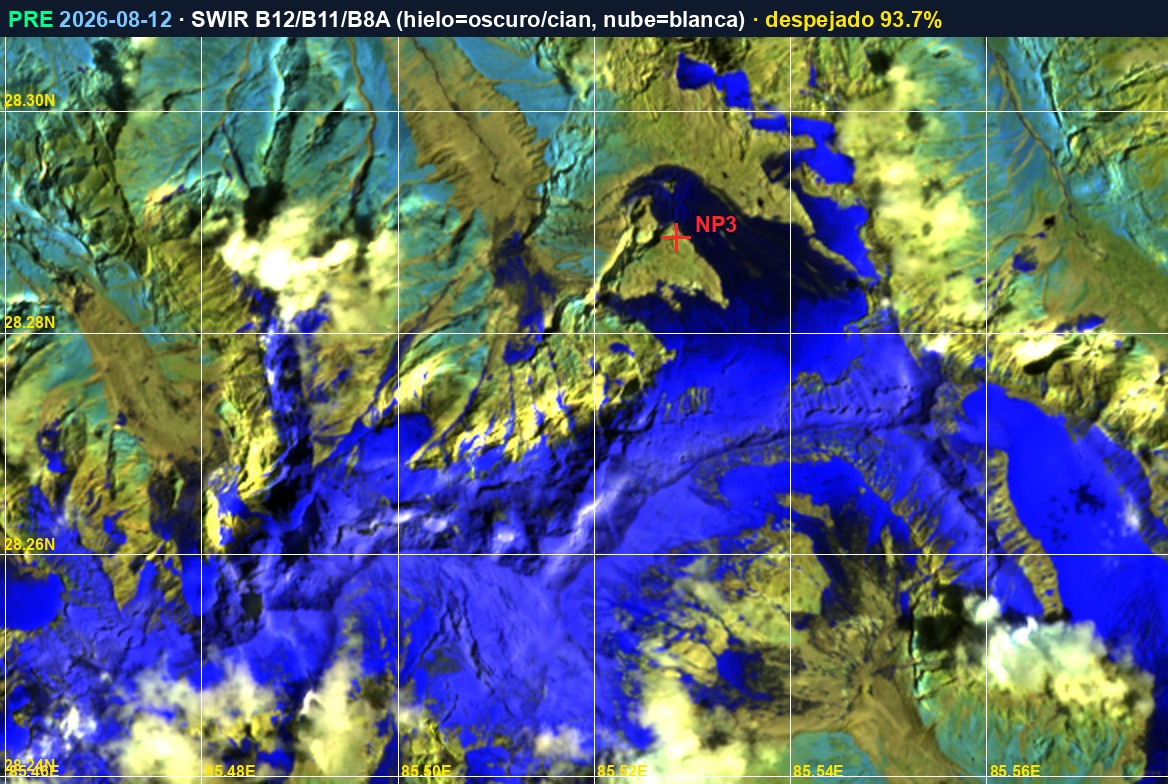
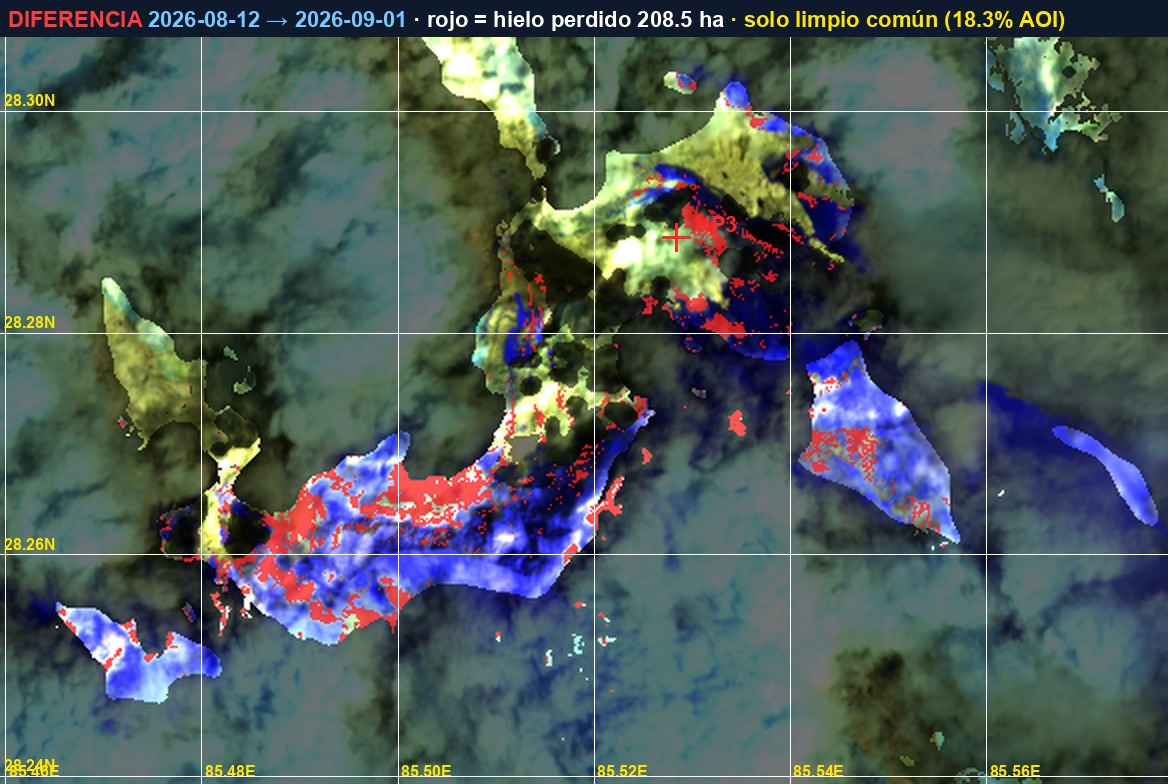
In true colour, cloud and snow are both white. In false-colour SWIR (B12/B11/B8A) cloud appears bright white and ice dark/cyan: one can look through the criterion, not guess. On that basis, NDSI > 0.4 counts hectares of ice/snow only over clean pixels common to the 12 Aug → 01 Sep pair (1,599 ha, 18.3% of the AOI — declared denominator): 604.6 ha in Dec 2024 → 805.4 ha on 12 Aug (ice + summer snow) → 638.5 ha on 01 Sep. Pre → post delta: −166.9 ha. This is a lower bound over the comparable strip, not the total loss — and part of what disappeared is seasonal snow, because NDSI does not distinguish snow from glacial ice.
Terrain and radar tell the same story
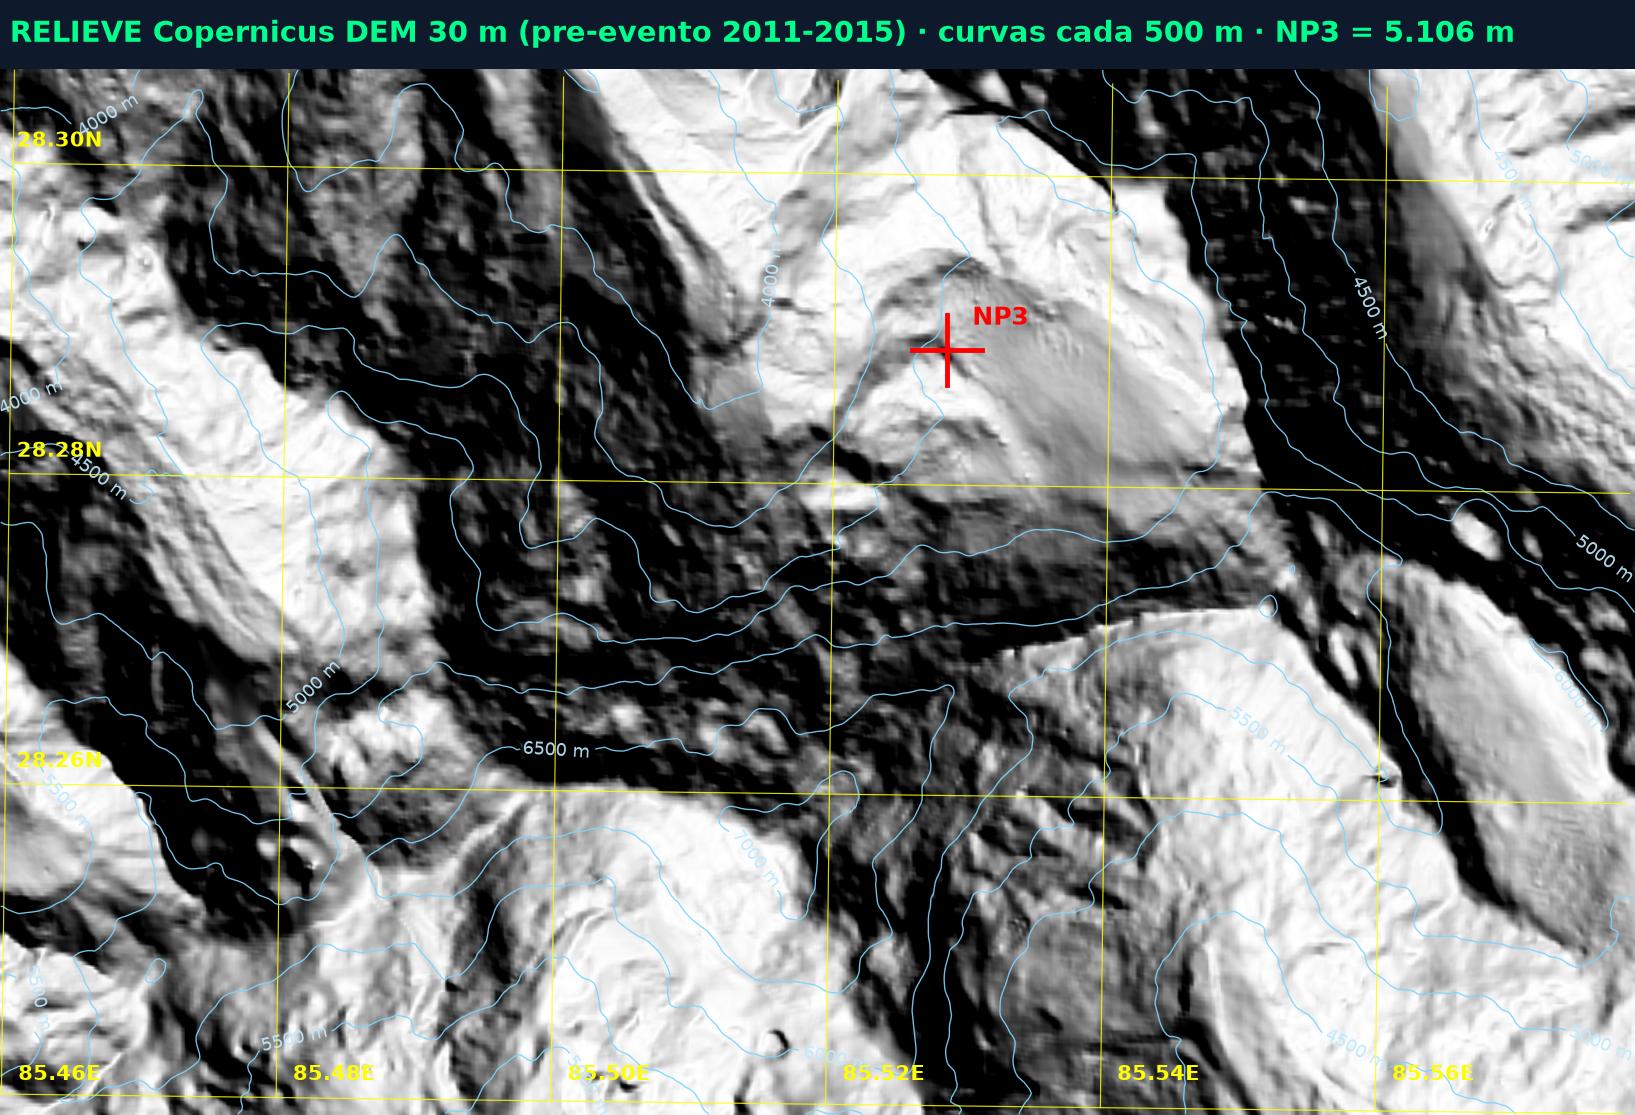
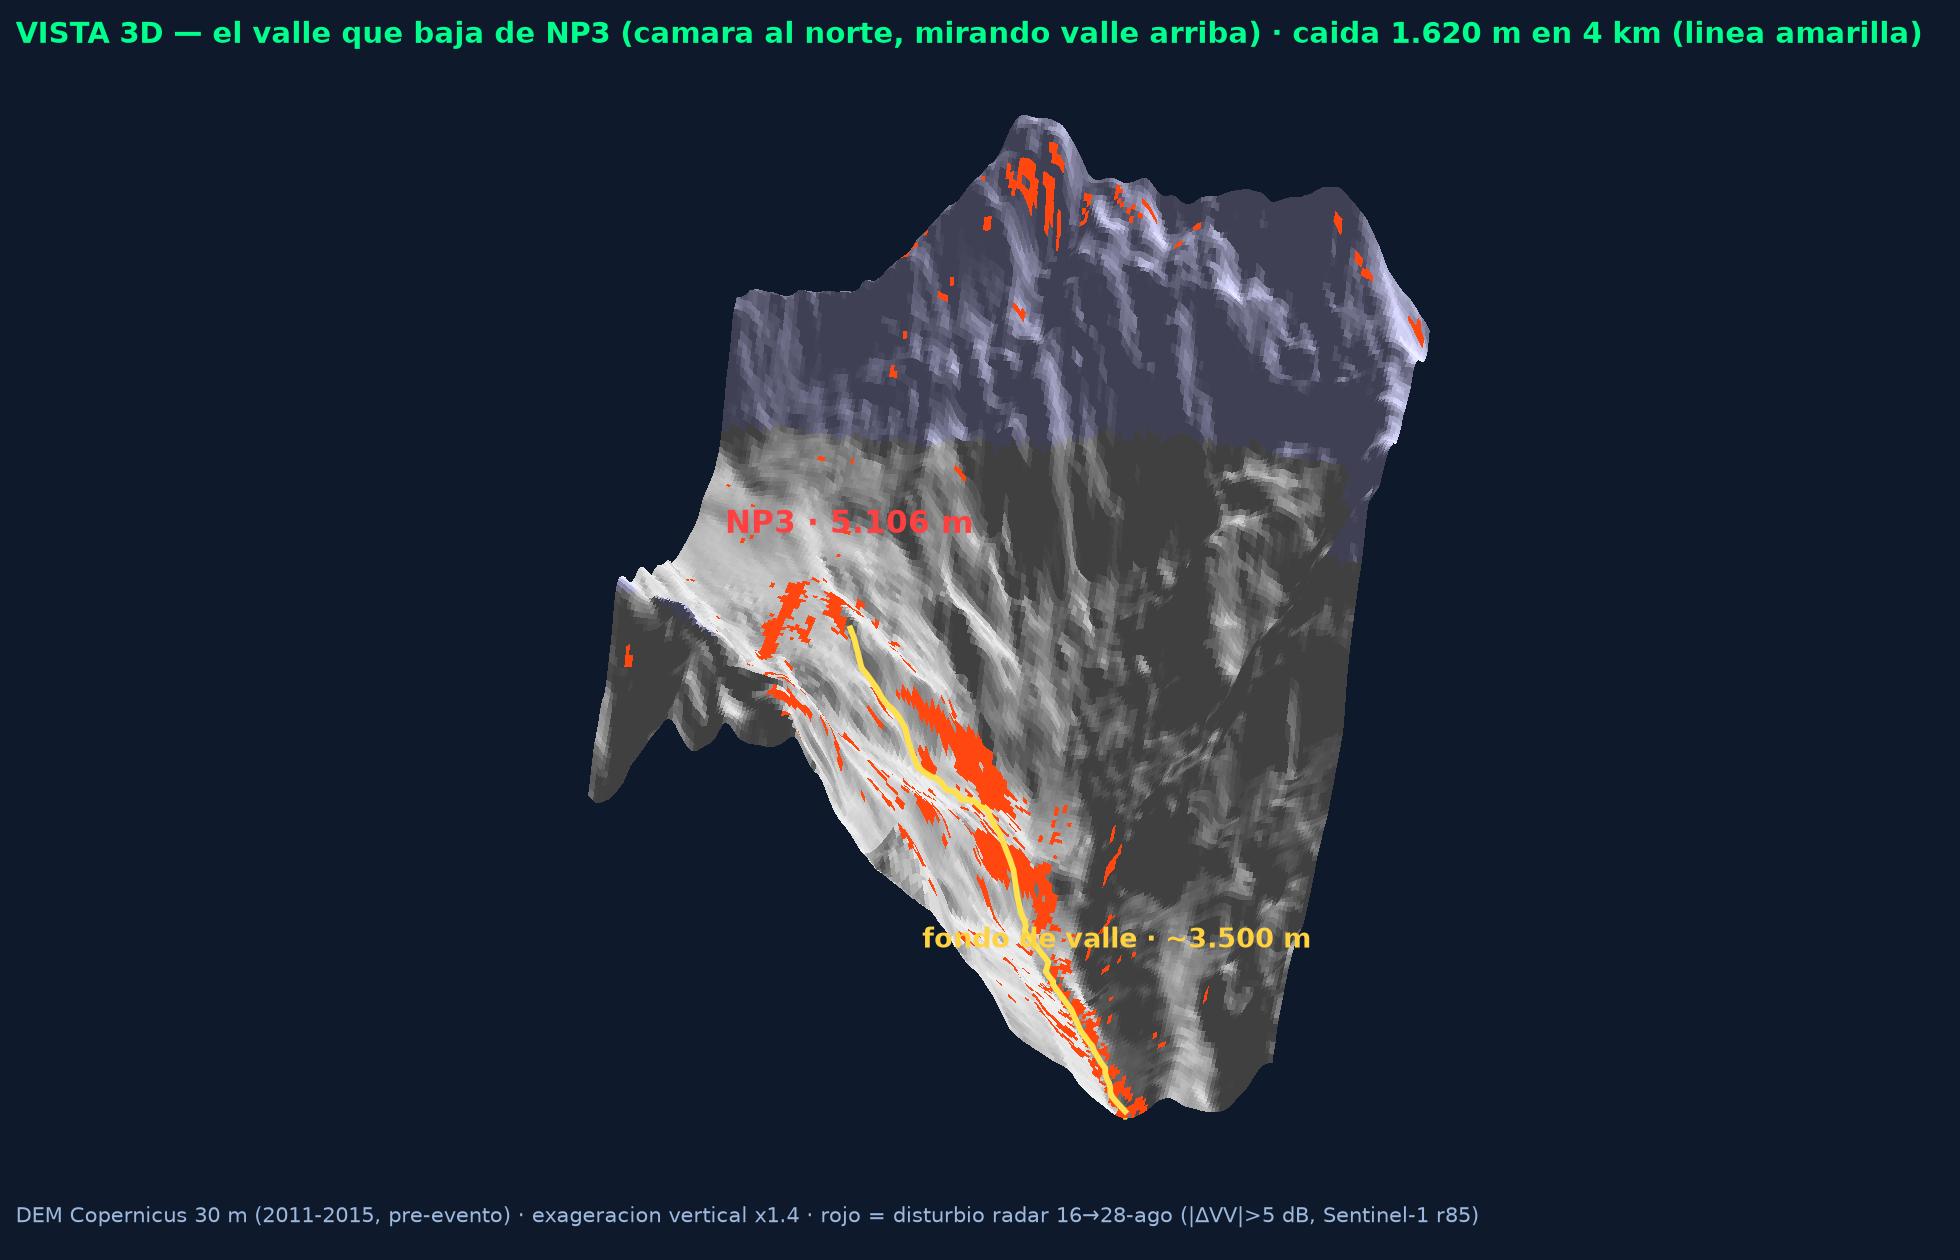
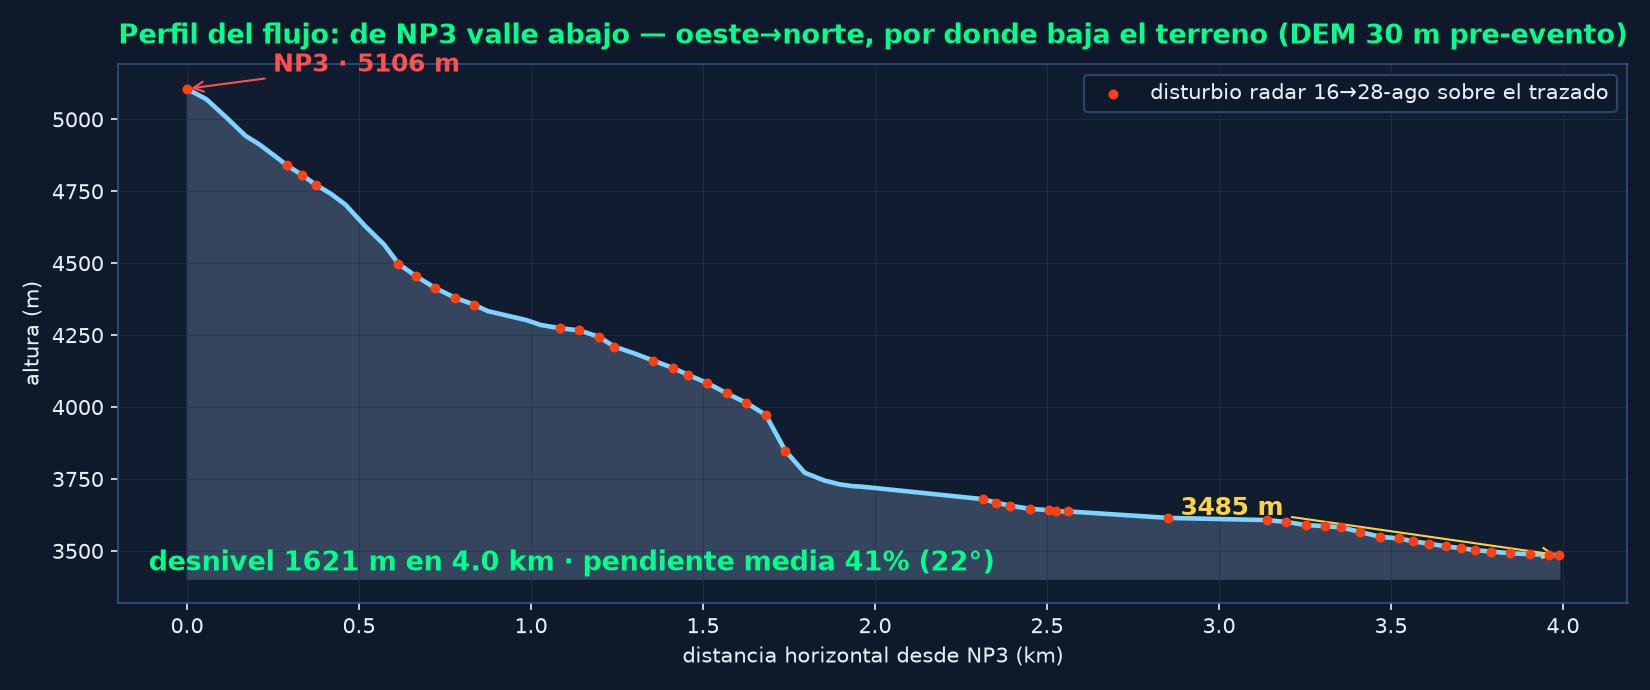
Over the Copernicus DEM GLO-30 (pre-event, 2011–2015 — relief context, not volume), the steepest-descent path from the NP3 point goes west and then north: from 5,106 m to 3,485 m valley floor — 1,621 m of drop over 4.0 km horizontal distance, mean slope 41% (22°). And here is the cross that matters: the radar disturbance corridor follows that path at 47 of 66 points. Two independent sources — the terrain from the DEM and the change from Sentinel-1 — tell the same story without consulting each other.
What this analysis does NOT claim
- The lake at the source is not measurable. Cloud over the exact point in all three POST optical passes. And the traps were detected and discarded: the SCL classifier marks glacier surface as "water" (74 ha false positives already in the PRE) and NDWI gives a false positive over snow. The radar signal drops at the source (85–117 ha by orbit) are consistent with both new water and a smooth deposit: indistinguishable without optical. The lake is neither affirmed nor denied.
- The source scar is not delimitable in optical: the best POST scene has ~48% clean in the clip. Exact delimitation awaits the first clear-sky pass.
- The −167 ha of ice/snow is a lower bound, not the total loss. It is measured over the 18.3% of the AOI clean in both dates; the rest was under cloud. Furthermore NDSI does not distinguish seasonal snow from glacial ice: part of what disappeared between 12 Aug and 01 Sep is summer snow.
- No volumes. Estimating the mobilised material requires a pre- and post-event high-resolution DEM. The DEM used (Copernicus GLO-30, 2011–2015) is pre-event and enters only as relief context; this analysis measures surfaces, not volumes.
- Thermal was not conclusive — and the attempt is declared. 56 Landsat scenes (LST ~100 m) were scanned for actual cloud by QA_PIXEL: the only POST available is from 26 Aug — the day of the event — with 92% cloud over the AOI. The jump from −1.3 °C (14 May) to +3.3 °C (26 Aug) in the NP3 box cannot be attributed to the collapse: there is a seasonal component, pixels at the edge of the cloud mask, and a tongue already covered with debris. Revisited post-monsoon.
- Radar under-detects in the canyon. Syabrubesi (0.41%) is a narrow reach in radar shadow/layover, and water-over-water change does not move ΔVV. The optical for the same reach does show widening — a qualitative observation, without NDWI measurement for this reach: "little radar change" ≠ "little happened".
- Structural damage and casualties are third-party data (authorities and assessments such as NP3 from HiRISK/ICIMOD), cited as such. This panel does not measure or verify them.
- The satellite delivers signal for prioritisation — where and how much the surface changed — not a damage diagnosis or an expert assessment.
The event is still active
According to Rapid Hazard Assessment NP3, a residual lake remains in the source zone: the scenario that justifies continued observation. Monitoring continues with each new pass, over the baseline that this analysis establishes.
Orbit r19 (descending, PRE from 24 Aug already available) delivers the third independent pair of the full corridor, with the event settled.
Each new optical scene adds a point to the series 45.6 → 154.1 → 209.9 ha (each pair with its declared denominator): whether the channel returns to its former width, stabilises widened, or the ponded bodies persist, the series will show it.
With the first clear optical pass, what is not measurable today will be resolved: residual lake and scar delimitation. Post-monsoon (Oct–Nov), with the AOI sustainably clear, NDSI and thermal are repeated over the full glacier.
Analysis derived from satellite data of the Copernicus Programme (ESA) — Sentinel-1 RTC (C-band radar), Sentinel-2 L2A (optical, 10–20 m), and Copernicus DEM GLO-30 — with the glacier outline from the Randolph Glacier Inventory 7.0 and event context from the Rapid Hazard Assessment NP3 (HiRISK / ICIMOD). It is an objective and reproducible record of surfaces, with a single before/after boundary and declared thresholds; it does not replace field assessment, does not measure volumes or structural damage, and cites as third-party what it did not measure.