Dique del Fuerte
Lago del Fuerte, the urban reservoir of Tandil: an artificial impoundment of ~16 hectares at the foot of the sierras, built as flood-control infrastructure after the 1951 floods (35 m dam, inaugurated in 1962) and transformed into the city's recreational heart — kayaking, fishing, bathing and Tandil's most iconic waterfront promenade. A water body where people enter the water: here trophic status is not only an environmental datum, it is public use information.
The perimeter and the water surface
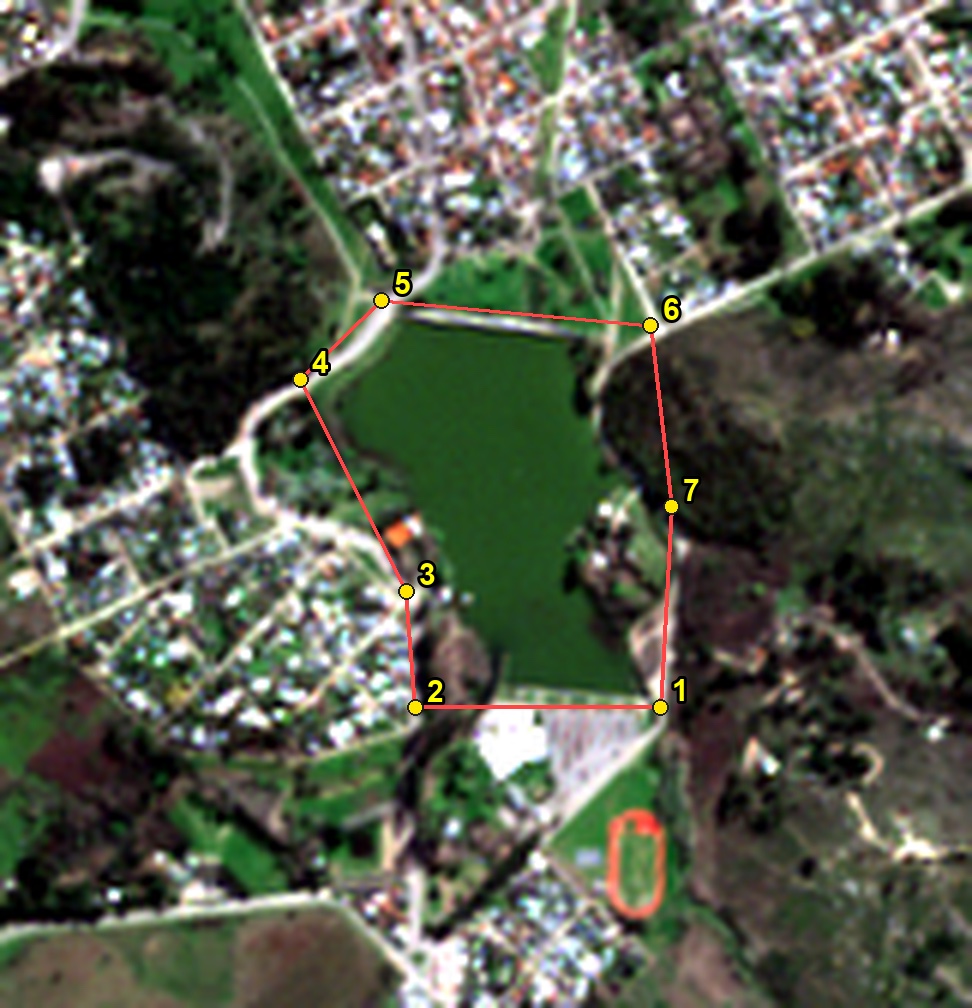
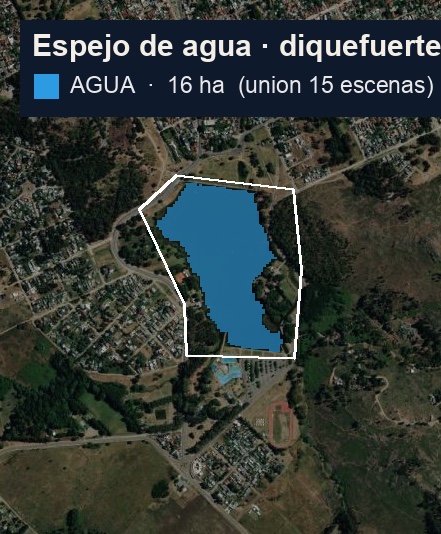
The analysis is cropped to the actual lake polygon (7 vertices marked on the Sentinel-2 image). The water surface is detected automatically (NDWI) within that boundary and filtered to the main contiguous water body — in urban environments NDWI can confuse dark rooftops and shadows with water; here the detection was clean: a single connected component, no false positives. Full extent: ~16 ha (stable core ≥50% of scenes: 15 ha). Centre: 37°21′S, 59°08′W (−37.345, −59.130) · View on Google Maps ↗
What is measured and how
Method before sensor: collect first, analyse afterwards, conclude only if the data support it. No prior hypothesis. Optical, thermal, and radar are combined when needed, along with a historical archive of four decades of satellite imagery. Reference standard: Copernicus Global Land Service — Lake Water Quality. Instrument and band details are described in how the platform works.
Method — Lago del Fuerte, full extent. Water extent is measured as the union of clear passes (NDWI): ~16 ha of actual water surface. Trophic analysis (chlorophyll, trophic status) is computed over the open-water core (core-water) — not over the shoreline, which biases it. Monthly series, best clean scene per month; a scene that does not observe the complete lake is discarded and gaps are shown, not interpolated. This is the same pipeline, with not a single adjusted parameter, that runs for all other water bodies on the platform — figures are comparable across water bodies.
Eight years of chlorophyll, in a film
Each frame is an actual satellite pass in which the lake is observed in full — 96 in total, from 2018 to 2026 (scenes with partial coverage are discarded). The colour represents NDCI (chlorophyll) on a fixed scale throughout the entire series. No interpolation or post-processing.
The diagnosis: eutrophic, with recurrent blooms
The indicator that summarises the health of a water body. Chlorophyll (NDCI) is converted to chlorophyll-a and then to the Trophic State Index (TSI), computed using the Res. ADA 1207/19 formula (Carlson modified by Aizaki) — the same value with which water bodies report to the water authority. Lago del Fuerte is classified as EUTROPHIC (TSI ≈ 64, 2018–2026 median): productive water with excess nutrients. 7 of the 96 passes exceed the hypertrophic threshold (TSI 70), distributed across five different years (2019, 2020, 2021, 2025 and 2026): algal blooms here are not an isolated event but a recurrent feature of the lake. The value is measured over the open-water core — where algae concentrate — not over the shoreline. In this water body the coverage filter passes nearly everything: 96 of 106 months have a reliable scene (remaining gaps are shown, not filled).
Method (standard): chlorophyll is measured over the open-water core (core-water) — not over the shoreline, which biases it —; NDCI → chlorophyll-a using the Mishra & Mishra (2012) model → TSI from Res. ADA 1207/19 (Carlson modified by Aizaki 1981: TSI = 10·(2.46 + ln Chl / ln 2.5), the art. 9 formula). Classes: <40 oligotrophic · 40–50 mesotrophic · 50–70 eutrophic · >70 hypertrophic. The classification is a satellite estimate without local calibration (the class is robust; the absolute mg/m³ value is indicative). This is the platform's canonical method (core-water), so that figures are comparable across water bodies. It prioritises and guides field sampling.
Chlorophyll time series (2018–2026)
Chlorophyll-a (mg/m³) of the lake, pass by pass, from 2018 to 2026. The dashed line marks the hypertrophic threshold (chl-a ≈ 64 mg/m³, TSI 70 on the Res. ADA 1207/19 scale). Gaps are months without a reliable scene — they are shown, not interpolated.
The pattern of the series: a high and sustained eutrophic baseline (the annual median ranged between TSI 60 and 66 over 2018–2025) with blooms appearing in different years: September 2019, September 2020, July 2021, February and June 2025. The quietest year was 2024 (median TSI 60). The key finding today is the recent deterioration: 2026 is the worst year in the series — median TSI 68, with 2 hypertrophic passes out of 9 (March and April), August one point below the threshold (TSI 69), and the 8-year historical peak on 12 Apr 2026 (76 mg/m³, TSI 72). The last twelve months run with a median TSI of 67. Several blooms fall in cold months (June, July, September): in this lake winter does not guarantee respite.
Note on hydrological regime: Lago del Fuerte is a mountain-reservoir water body: it is governed by local rainfall in the stream catchment (Langueyú, Salado system), not by the Paraná–Luján corridor hydrology shared by the other water bodies on the platform. Its series is therefore not validated against the regional 2020 event (Paraná low-water period) — this is a different regime, and the difference is declared rather than forcing the comparison.
Note on temperature: the platform's standard thermal series requires pure-water Landsat pixels (100 m pixel, away from the shoreline), achievable only for large water bodies. At Lago del Fuerte (~16 ha), 100 m of shoreline erosion leaves barely ~3 pure thermal pixels — below that standard, and a one-pixel registration offset contaminates them. For this reason no thermal series is published. A declared physical sensor limitation — not an omitted data point.
2026: the worst year in the eight-year record
What is notable about 2026 is not an isolated peak but the shift of the entire baseline: the annual median jumped to TSI 68 — above the median of each of the previous seven years (the prior maximum was 66). Autumn sums it up: March hypertrophic (TSI 71), April with the historical maximum of the series (chlorophyll-a 76 mg/m³, TSI 72), and after a brief respite in May, August returned close to the threshold (TSI 69) — a severe bloom in the middle of the sierra winter. The latest pass (4 Oct 2026) measures TSI 64.0, four points below the September pass (68.3) and still in the Orange band: the lake enters spring — its historically most productive season — with the baseline at its highest point.
A declared regime difference: in the Paraná–Luján corridor water bodies monitored by the platform (Nordelta, El Naudir, El Cazal), the shared critical year was 2020, synchronised with the historical Paraná low-water event. Lago del Fuerte also recorded a hypertrophic event in 2020 (September; October fell just below the threshold) — but its series does not organise around that event: it is a mountain reservoir in the Salado catchment, governed by local rainfall and the nutrients from its own urban catchment, and its blooms are distributed across five different years. The corridor's regional cross-validation does not apply here — this is not a method anomaly, it is a different hydrological regime.
Current status of the water body
Lago del Fuerte is a high-eutrophic water body (median TSI 64, chlorophyll-a ~37 mg/m³) with recurrent blooms: 7 hypertrophic passes in 8 years, distributed across five different years, including several in cold months. The series — 96 passes, the densest on the platform — shows a water body stable at its high level until 2025 and a clear deterioration in 2026: the worst year measured, with the historical peak in April and the annual baseline at its highest point. On the official Res. ADA 1207/19 scale, the latest pass enters spring at ORANGE (TSI 64) — the 61–80 band, with the regulation's penalty threshold at 80.
Assessment: this is a lake where people enter the water — kayaking, fishing, bathing — and where trophic status is, in addition to an environmental datum, public use information. The value of satellite monitoring here is twofold: the continuous baseline that documents the 2026 deterioration with date and magnitude, and the ADA official-scale status updated with each pass as an early signal to prioritise field sampling — which is the only method that confirms or rules out cyanotoxins. Concrete operational recommendation: targeted sampling now, at the start of spring 2026, with the lake at its highest baseline entering its highest-risk season.
Satellite monitoring provides a signal for prioritising where and when to sample, not a laboratory diagnosis. It complements — it does not replace — physical-chemical analysis and sign-off by a licensed professional.