The 12 areas
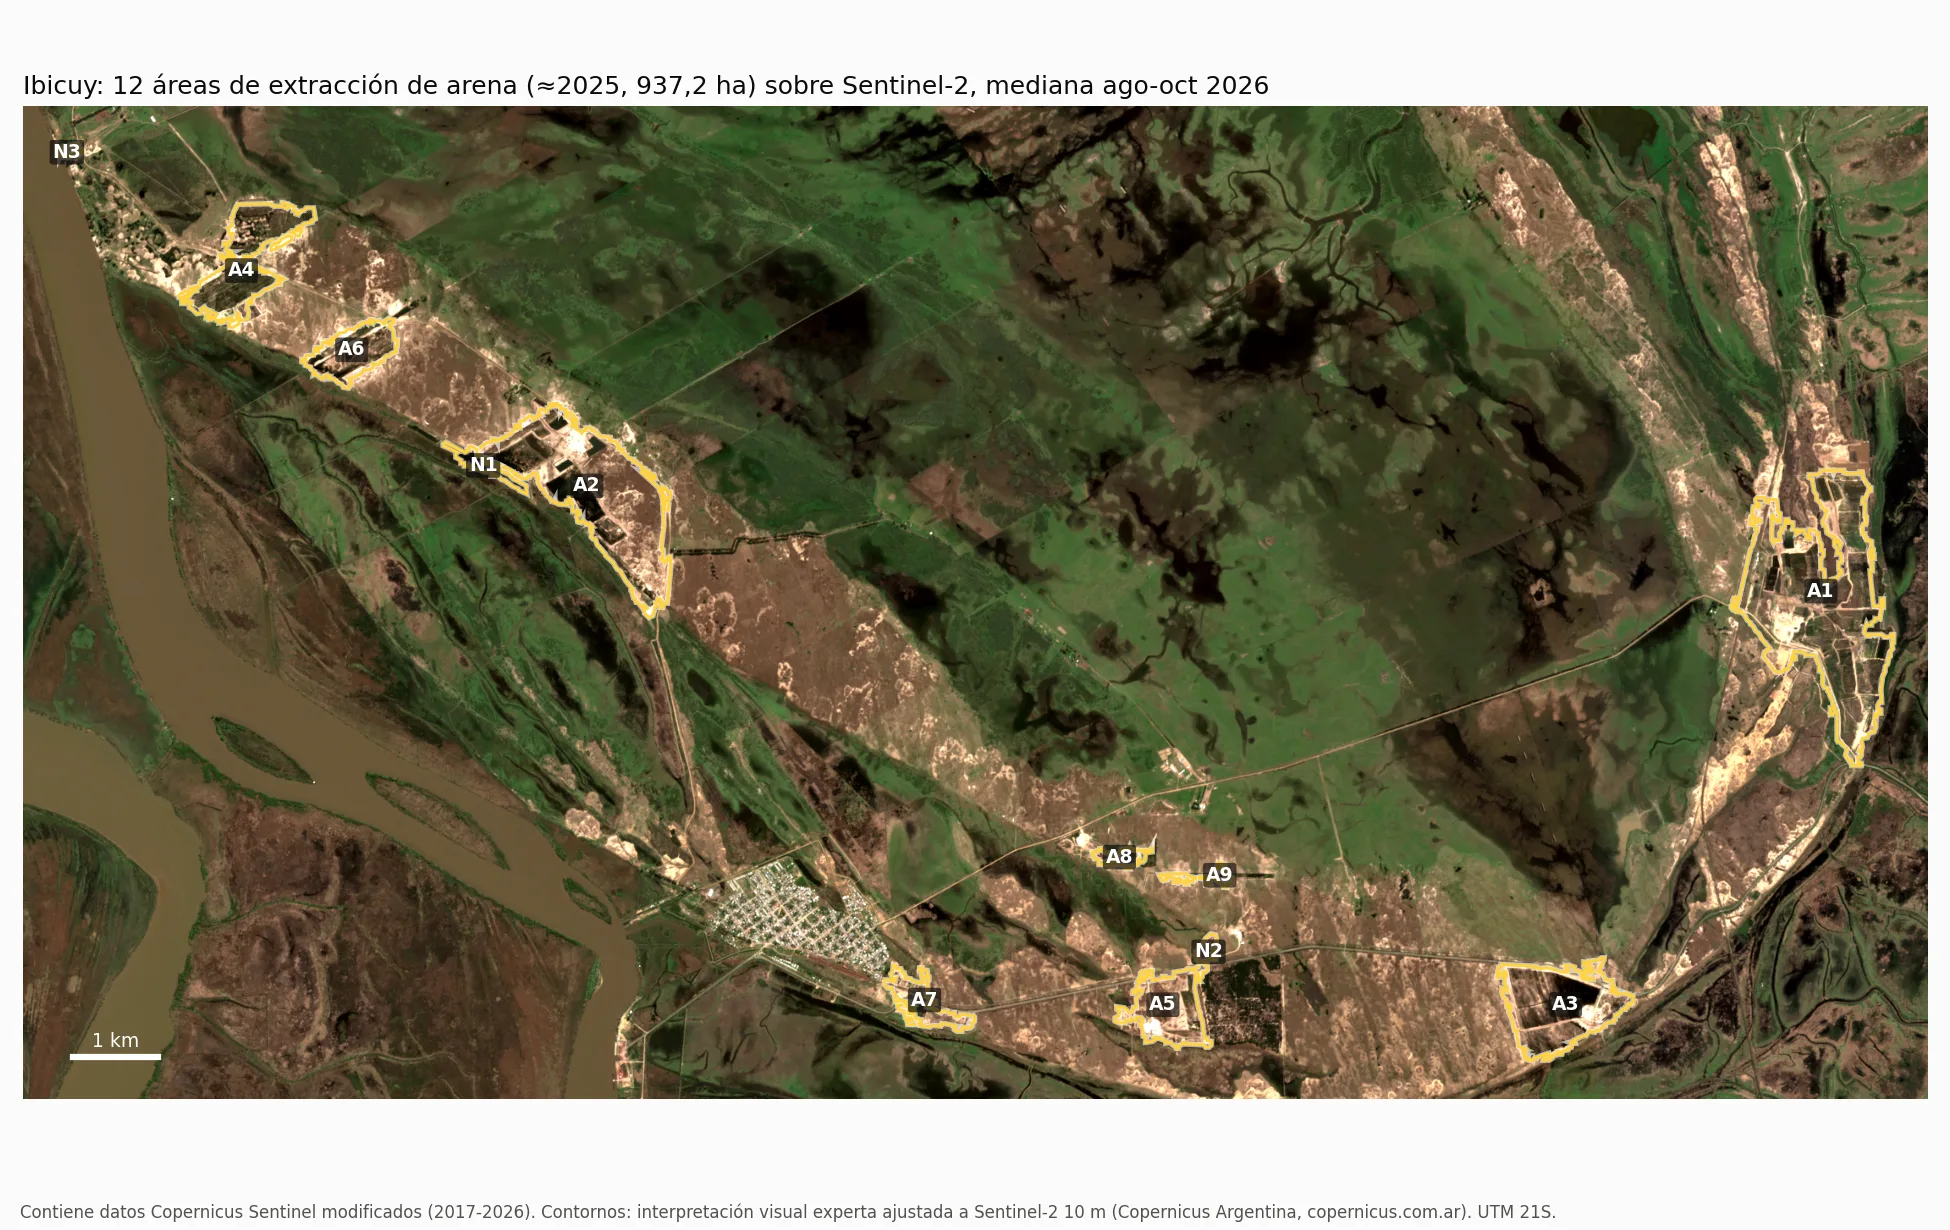
Each outline is a 10 m approximation of the extraction area around 2025, not a cadastral boundary. The polygons were delineated by expert visual interpretation supported by high-resolution imagery and adjusted to Sentinel-2 (10 m): the boundary was fitted within ±60 m to the sand, water and road surface visible in the 2024–2026 Sentinel-2 composite. The series are computed only from Sentinel-2 and Landsat.
The 2017–2026 series
Cumulative footprint. It is the surface that at any time since 2017 was exposed sand or excavation water within the 12 areas; it never decreases. It is published as a band, not as a single figure: in 2026 it lies between 192 ha (conservative band, which excludes only the sand exposed in dry years and always counts water in excavation) and 458 ha (broad band, which includes that sand). In 2020 it was between 109–196 ha and in 2023 between 157–378 ha. Both bands are lower bounds. The conservative band depends on which years are considered wet and on the majority rule: depending on the variant it ranges from about 160 to about 215 ha in 2026 (see the dataset method); the broad band varies ±4 %.
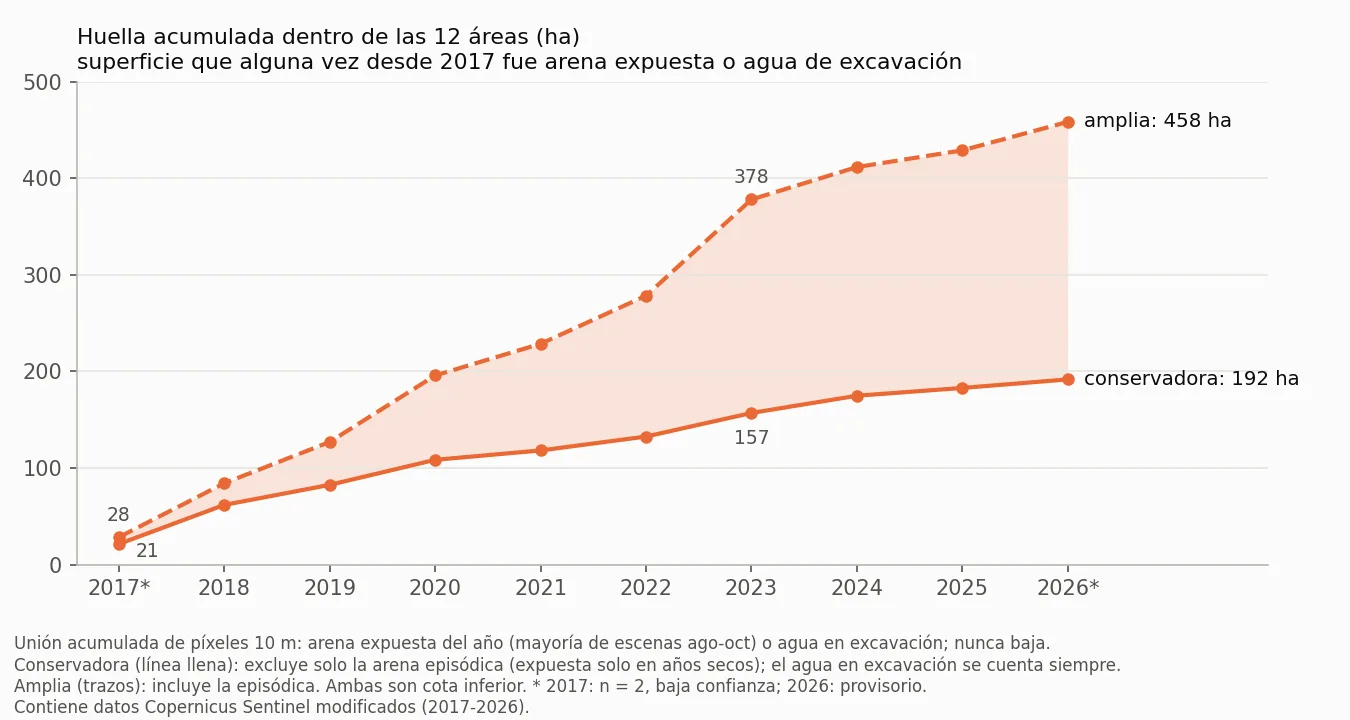
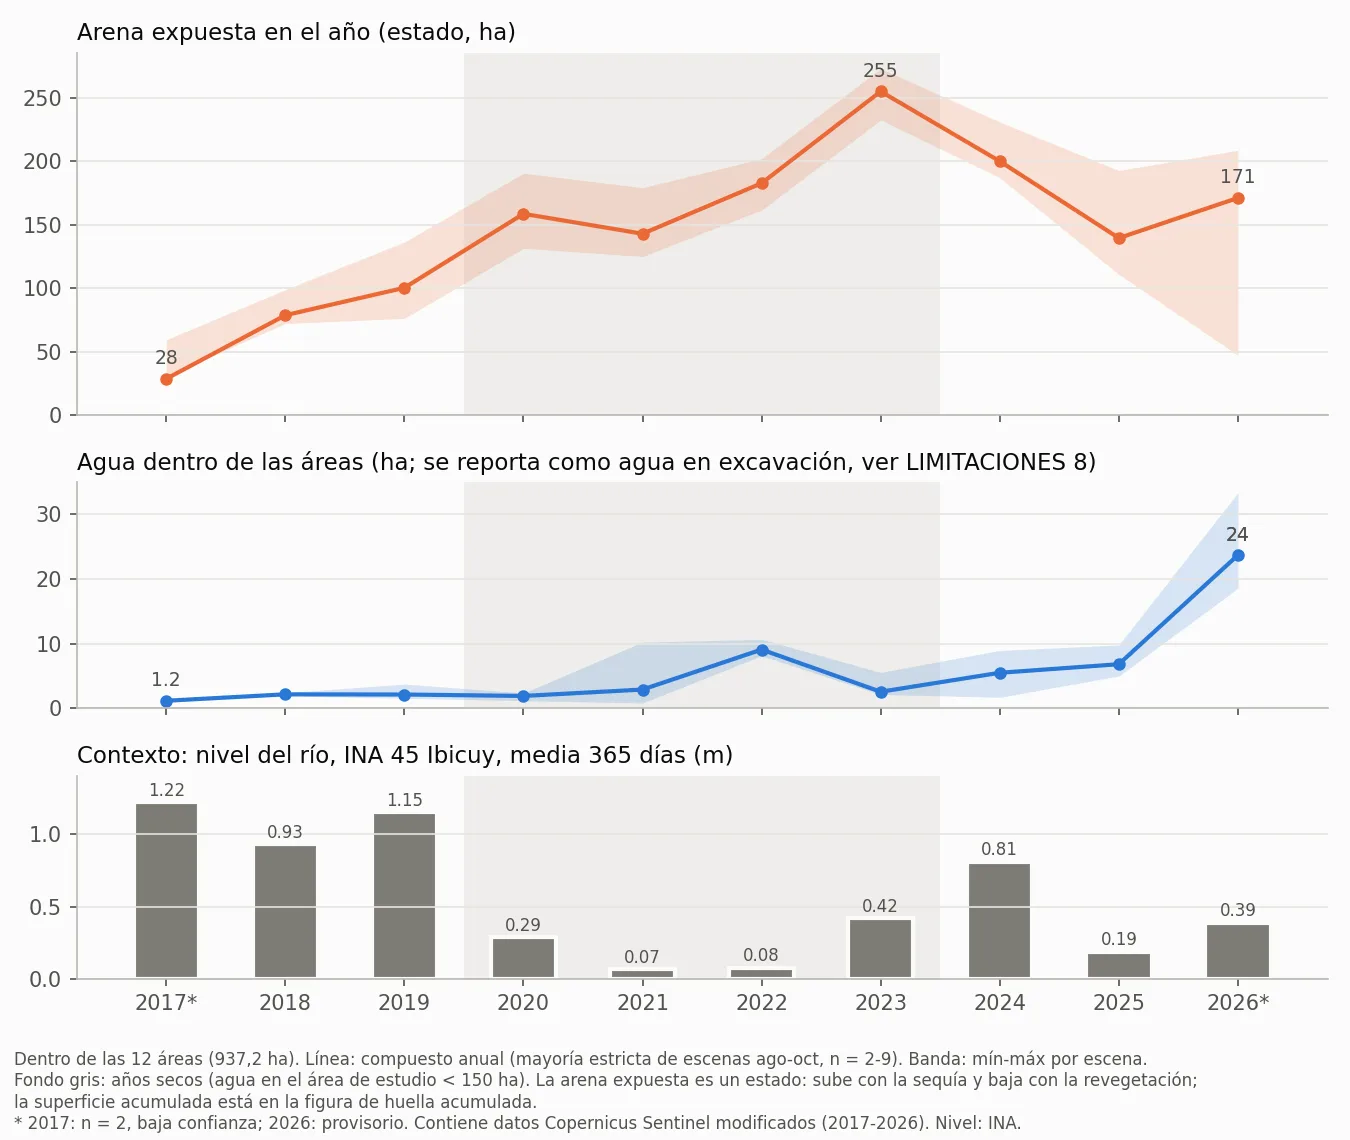
Sand exposed in the year. It is a state: the sand visible each year. It rose from 100.2 ha in 2019 to 254.9 ha in the 2023 drought and was 139.4 ha in 2025 and 171.0 ha in 2026. It falls after 2023 because most of it becomes classified as vegetation or other cover: of the 150.5 ha that stop being sand between 2023 and 2025 within the study area, 147.1 ha are vegetation or other cover in 2025 and only 1.8 ha become water. Water within the areas (reported as excavation water) stayed between 1.2 and 9.1 ha until 2025 and reached 23.7 ha in 2026, a year preceded by rainfall. Each value is the year's composite (what is seen in the majority of the August–October scenes); the range shows the minimum and maximum across scenes.
| Year | Scenes | Cumulative footprint (ha, conservative–broad) | Sand exposed in the year (ha) | Range across scenes | Water within the areas (ha) | River, 365-day mean (m) |
|---|---|---|---|---|---|---|
| 2017 (low confidence, n = 2) | 2 | 21.4–28.5 | 28.5 | 30.4–59.3 | 1.2 | 1.22 (wet) |
| 2018 | 5 | 61.9–84.3 | 78.6 | 72.1–98.7 | 2.2 | 0.93 (wet) |
| 2019 | 9 | 82.7–127.1 | 100.2 | 76.1–136.2 | 2.1 | 1.15 (wet) |
| 2020 | 5 | 108.6–195.9 | 158.5 | 131.3–190.5 | 1.9 | 0.29 (dry) |
| 2021 | 9 | 118.3–228.7 | 142.8 | 124.8–179.0 | 2.9 | 0.07 (dry) |
| 2022 | 5 | 132.7–278.4 | 182.6 | 161.4–201.9 | 9.1 | 0.08 (dry) |
| 2023 | 7 | 157.1–378.0 | 254.9 | 232.5–272.9 | 2.6 | 0.42 (dry) |
| 2024 | 6 | 174.9–411.6 | 199.9 | 186.8–230.9 | 5.5 | 0.81 (wet) |
| 2025 | 8 | 183.0–428.9 | 139.4 | 110.8–192.6 | 6.8 | 0.19 (wet) |
| 2026 (provisional) | 6 | 191.8–458.4 | 171.0 | 47.0–208.5 | 23.7 | 0.39 (wet) |
Composition around 2025 and year of first evidence
Around 2025, 14.9 % of the surface of the areas is exposed sand, 0.7 % is water and 84.4 % is vegetation or other cover (at 10 m the two cannot be separated). The year of first evidence combines three sources: the new road network, the persistent spectral change in Landsat and the appearance in Sentinel-2; the detector cannot state anything before 1989 and three areas (A2, A4, A7) are dated with a weak signal.
| Area | Name | Area (ha) | Exposed sand (ha) | Water (ha) | Vegetation/other | Cumulative footprint to 2025 (ha) | First evidence |
|---|---|---|---|---|---|---|---|
| A1 | Arco E | 324.7 | 55.3 | 3.5 | 81.9 % | 60.6–141.9 | 2006 (medium) |
| A2 | NO (R025) | 227.5 | 25.7 | 3.1 | 87.3 % | 43.8–103.6 | 1999 (medium; weak signal) |
| A3 | Centro-S, trench field and plant | 115.6 | 21.6 | 0.0 | 81.3 % | 24.9–78.9 | 2013 (medium) |
| A4 | Extremo NO | 91.4 | 7.3 | 0.0 | 92.0 % | 9.2–25.3 | 1993 (medium; weak signal) |
| A5 | Sur | 63.2 | 14.5 | 0.0 | 77.1 % | 20.9–36.6 | 2019 (high) |
| A6 | NO medio | 49.0 | 7.6 | 0.0 | 84.5 % | 14.1–17.6 | 1994 (medium) |
| A7 | Planta Sur | 29.5 | 2.7 | 0.0 | 91.0 % | 5.7–10.5 | 2009 (medium; weak signal) |
| A8 | Centro-S 1 | 9.2 | 1.8 | 0.0 | 80.0 % | 0.9–3.2 | 2023 (high) |
| A9 | Centro-S 2 | 6.9 | 0.6 | 0.0 | 91.3 % | 2.5–5.1 | 2023 (high) |
| N1 | NO, sector N1 | 11.9 | 0.1 | 0.2 | 97.1 % | 0.3–2.1 | 2017 (medium) |
| N2 | Centro-S, sector N2 | 5.4 | 0.3 | 0.0 | 94.4 % | 0.1–1.2 | 2021 (high) |
| N3 | Extremo NO, sector N3 | 3.0 | 1.8 | 0.0 | 38.8 % | 0.0–2.8 | no data |
| Total | 12 areas | 937.2 | 139.4 | 6.8 | 84.4 % | 183.0–428.9 |
1990 and 2026
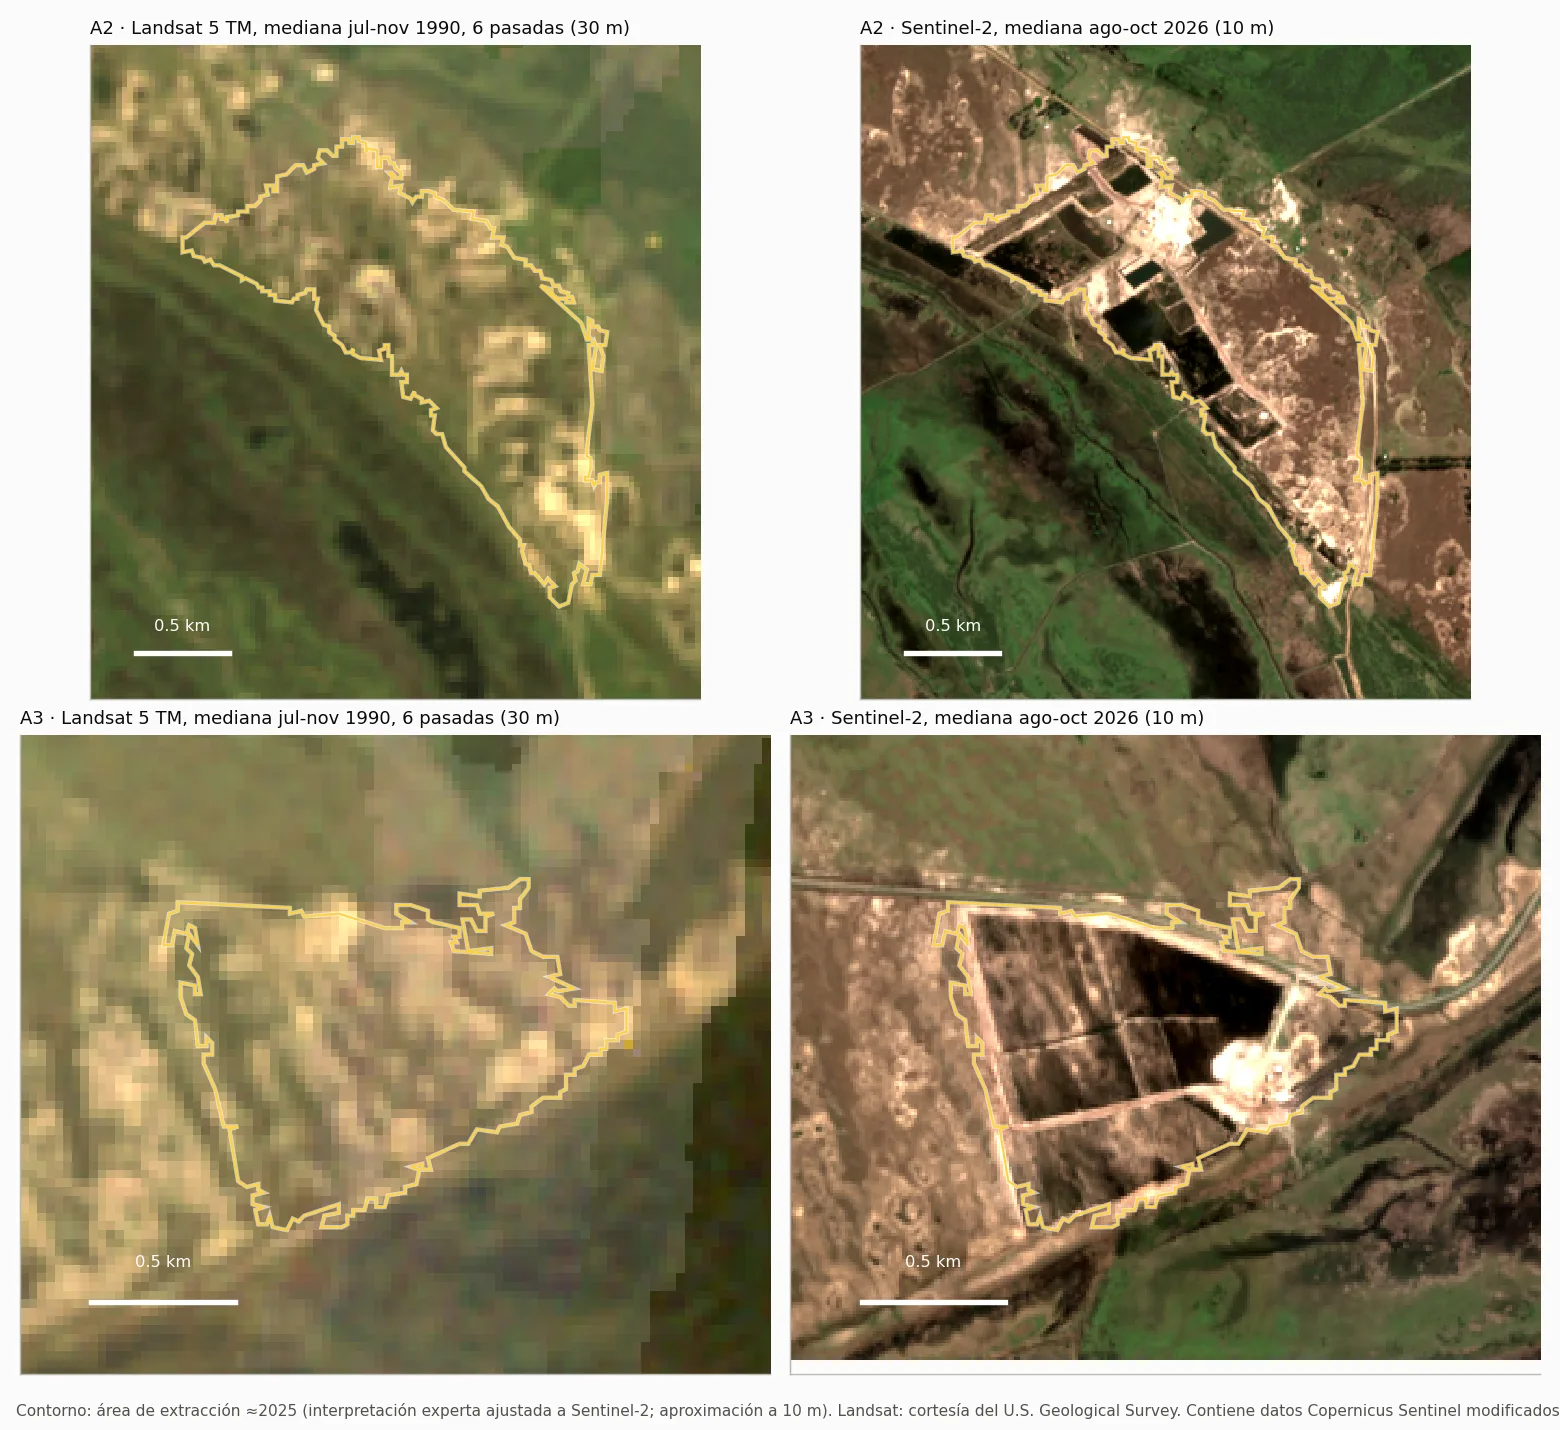
Areas A2 and A3 in a 1990 Landsat 5 median and in Sentinel-2 2026, with the same outline.
What it measures and what it does not
Surfaces are a lower bound. The classification is correct where it marks sand or water (user's accuracy 0.96–1.00), but it omits part of the surface (producer's accuracy of 0.08–0.13 for sand). The values are measured minimums.
Extent around 2025. The areas describe the extent around 2025; the series measures what happened each year within that perimeter. The surface of each year before 2017 cannot be measured at 30 m; for that period the year of first evidence per area is reported, which is an upper bound of the opening (±1 year). The 2017 pixels (two scenes, low confidence) remain in the cumulative footprint of all following years.
Band, not figure. The cumulative footprint is always communicated as a conservative–broad band: the distance between the two is sand that is exposed only in dry years and that, with these data, cannot be separated between extraction and natural lows that dry out.
No volume or depth. The sensors used do not measure elevation: no volume or tonnage is reported.
Who publishes it. This is independent work by Copernicus Argentina on open data. The hydrological context (river level, rainfall) accompanies the series without attributing causes.
Technical sheet
| Parameter | Value |
|---|---|
| Sensors | Sentinel-2 L2A (Copernicus) · 10 m · Landsat 5/7/8/9 C2 L2 (USGS) · 30 m |
| Areas | 12 · 937.2 ha · UTM 21S · state ≈2025 |
| Delineation | expert visual interpretation adjusted to Sentinel-2 (10 m boundary within ±60 m) · balanced accuracy 0.76–1.00 · IoU 0.84 |
| Exposed sand | sand/mineral soil (NDVI < 0.25, brightness > 0.11, NDTI ≤ 0.10) in the majority of Aug–Oct scenes |
| Cumulative footprint | cumulative union 2017→year · conservative: exposed sand without the episodic sand, plus water in excavation · broad: with the episodic sand · always as a band |
| Series | 2017 → 2026 · 62 scenes · median, minimum and maximum per year |
| Dating | new road network · Landsat spectral break 1989–2024 (window 1985–2026) · appearance in Sentinel-2 |
| Context | INA, Sistema de Información y Alerta Hidrológico, series 45 Ibicuy (aggregates only) · ERA5 rainfall (Copernicus Climate Change Service) via Open-Meteo |
| License | CC BY 4.0 |
Open data
The whole series can be downloaded freely, with attribution. DOI 10.5281/zenodo.23531745 · Zenodo · Hugging Face.
| File | Content |
|---|---|
| huella_explotacion_2025_s2.geojson | The 12 areas (≈2025), with area and method. |
| series_anuales.csv | Per area and year 2017–2026: cumulative footprint (conservative and broad), exposed sand and water, with n, minimum, maximum, dates and river level. |
| composicion_2025.csv | ≈2025 composition per area. |
| fechado_areas.csv | Year of first evidence per area, source, confidence and uncertainty. |
| contexto_hidrologico.csv | Natural water, INA 45 level (aggregates) and rainfall, 2017–2026. |
| scenes.csv · thresholds.json | Sentinel-2 and Landsat scenes used; all thresholds of the method. |
| capas_10m_epsg32721.tif · area_estudio_v2.geojson · code/ | Per-pixel layers (10 m), study area and scripts to reproduce the cumulative footprint and the composition. |
How to cite the data: Copernicus Argentina; Kovacevic, G. R. (2026). Ibicuy: footprint of sand extraction, 2017-2026 (dated opening per area from 1993) (v1.0) [Data set]. Zenodo. https://doi.org/10.5281/zenodo.23531745
Contains modified Copernicus Sentinel data (2017-2026). Landsat: courtesy of the U.S. Geological Survey. River level: INA, series 45 Ibicuy (third-party data, accessed 2026-10-20; aggregates only).
A quarry, a neighbourhood or a municipality you need to follow from space? The same series can be built for any area.
Request an assessment